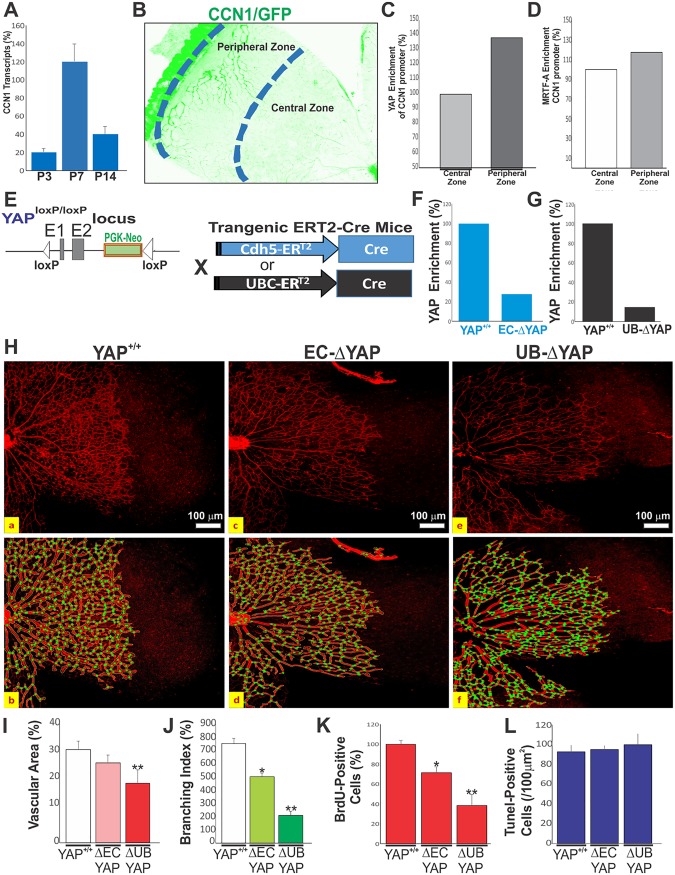
FIG 3.
YAP-dependent transactivation of the CCN1 gene during retinal vascular development. (A) CCN1 mRNA levels determined by qPCR in mouse retinas at P3, P7, and P14. Data shown are means ± SE (n = 4). (B to D) YAP enrichment of the endogenous CCN1 promoter determined by ChIP assay. DNA was immunoprecipitated from retinal homogenates pooled from 10 mouse eyes of each genotype (YAP+/+, EC-ΔYAP, and UB-ΔYAP). YAP- and MRTF-A-immunoprecipitated DNA was quantified by qPCR. (E) Schematic diagram showing conditional targeting of the YAP genomic locus with Cdh5-Cre ERT2 and UBC-Cre ERT2 mice. (F and G) YAP enrichment of the proximal TEAD site of the endogenous CCN1 gene was analyzed by ChIP assay. (H) Representative immunofluorescence images of IB4-stained retinal flat mounts at P6 of YAP+/+, EC-ΔYAP, and UB-ΔYAP mice. Vascular features were analyzed with AngioTool software (as shown in panel b for panel a, as shown in panel d for panel c, and as shown in panel f for panel e). The outline of the vasculature is shown in black, the vasculature skeleton representation is shown in red (top row), and branching points are shown in green (bottom row). (I to K) Quantitative analysis of vascular parameters (i.e., vascular area [I], junction density [J]) of representative retinas from wild-type and mutant mice. **, P < 0.05 versus YAP+/+ mice (n = 4) of the same age. (K) Quantitative analysis of EC proliferation at P6, as determined by BrdU incorporation. Equivalent areas of retinas from YAP+/+, EC-ΔYAP, and UB-ΔYAP mice were compared. Data are means ± SE. *, P < 0.05 versus YAP+/+ mice; **, P < 0.001 versus YAP+/+ mice (n = 4). (L) Quantification of TUNEL-positive cells in retinal sections of wild-type and YAP mutant mice (n = 6 for each group). Data are presented as means ± SE (n = 6).

