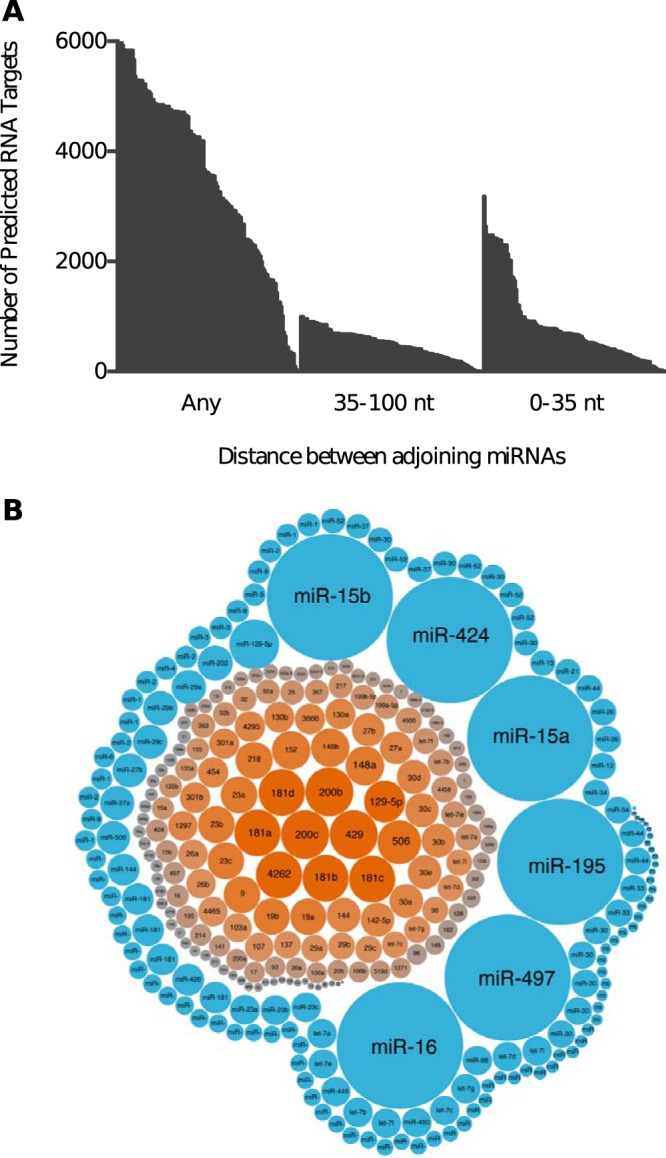
FIG 7.

Adjoining miRNA sites separated by 35 to 100 nt are overrepresented on target 3′ UTRs. (A) Distribution plot showing the number of potential targets for 167 adjoining miRNA sites separated by 35 to 100 nt or 0 to 35 nt or with no distance constraints (Any). (B) Bubble chart showing the specific miRNAs that were overrepresented as adjoining pairs separated by either 35 to 100 nt (orange) or 0 to 35 nt (blue). The larger bubble size indicates a greater number of targets with adjoining sites for the specific miRNA.
