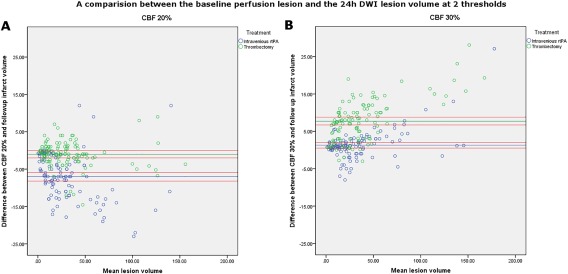
Figure 2.

Two Bland‐Altman plots comparing the differences in volumes presented with baseline core estimates using a CBF 30% threshold in (A) and a CBF 20% in (B). The volume of the CBF 30% (A) or 20% (B) core estimate are presented on the x‐axis divided by treatment type with patients in blue representing those who received rtPA and green representing those who had thrombectomy. The absolute volume difference between the baseline ischemic core volume at a CBF threshold and the 24‐hour core volume are presented on the y‐axis. The mean volume difference is represented by the green line and the 95% CIs are represented by the red lines. Applying a single perfusion threshold for both the thrombectomy and intravenous lytic treatment groups for infarct core prediction resulted in significant differences compared to setting separate thresholds for thrombectomy and for lytic‐treated patients. For alteplase‐treated patients, the CBF 30% threshold (B) was optimal and had a mean absolute difference between the baseline and 24‐hour core volume of −1.5ml (−11.8 to 13.39). However, for patients receiving thrombectomy, the CBF 30% ischemic core threshold significantly overestimated the resulting ischemic core volume. For thrombectomy‐treated patients, the CBF 20% threshold (A) was optimal and had a mean absolute difference between the baseline and 24‐hour core volume of 2.6ml (−4.3 to 8.7). CBF = cerebral blood flow; CI, confidence interval; rtPA = recombinant tissue plasminogen activator. [Color figure can be viewed at www.annalsofneurology.org]
