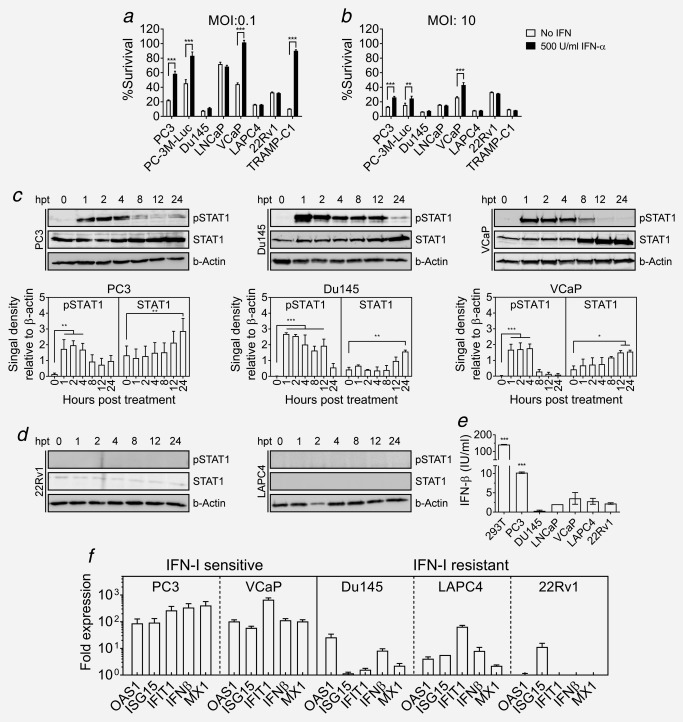
Figure 3.

IFN‐I induced antiviral response in PCa cell lines. (a,b) Capacity of PCa cell lines to mount an IFN‐I‐induced antiviral response was studied. Cell monolayers were treated with 500 U/ml of IFN‐I or PBS for 16 hr prior to infection with VSV‐GP at an MOI of 0.1 (a) or MOI of 10 (b). Cell viability of the infected cultures was determined 72 hr postinfection using WST‐I reagent as indicated before. (c) Monolayers of PC3, Du145 and VCaP cell lines were treated with 100 U/ml IFN‐I. At indicated time‐points, lysates were prepared and analyzed for STAT1 expression and phosphorylation, using β‐actin as loading control. Representative blots and quantification of signal density relative to β‐actin are shown. (d) Representative blots of 22Rv1 and LAPC4 cells treated as in (d). (e) Production of IFN‐I by infected cultures was determined. Cell monolayers were infected with VSVncp‐ΔGGFP* GP at MOI of 3 or mock treated with PBS. Supernatant was collected 24 hr postinfection and concentration of IFN‐β was measured using a specific ELISA. Bars represent mean IFN‐β concentration ± SEM in VSVncp‐ΔG‐GFP*GP treated supernatants (***p < 0.001 compared to noninfected). (f) Monolayers of prostate cancer cell lines were treated with VSVncp‐ΔG‐GFP*GP at an MOI of 3 or mock treated with PBS. mRNA was extracted 24 hr post‐treatment, reverse‐transcribed to cDNA and expression of indicated genes was analyzed by real‐time PCR. Fold expression of the selected genes was calculated relative to GAPDH and the mock treated sample.
