
Figure 3.
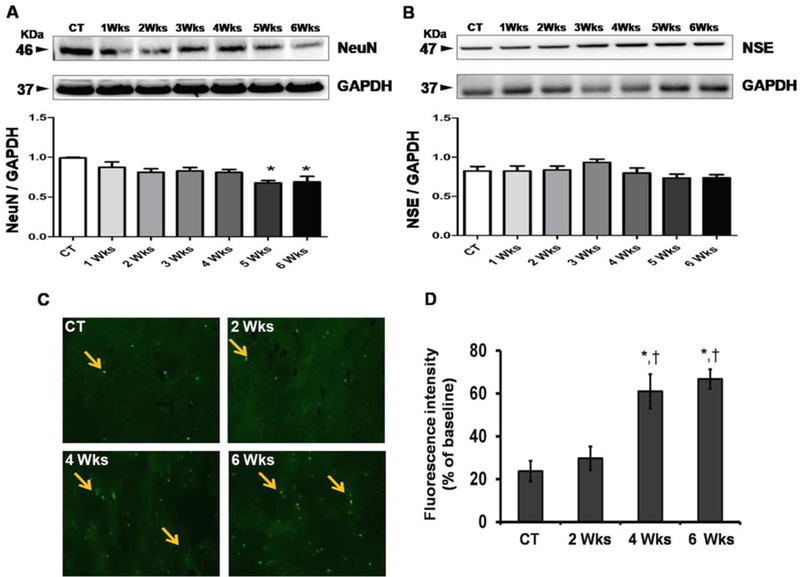
Representative data of neuronal dysfunction in control and HM-LF-LV diet fed mice. (A-B) Western blot images and their corresponding densitometric analysis of the levels of NeuN and NSE in different mice groups; (C) Fluorescence microscopic images of control mouse and mice fed with HM-LF-LV diet. Arrows indicating cell bodies of neurons with neuronal degeneration. (D) Histogram showing comparative analysis of fluorescence intensities between control and HM-LF-LV diet fed mice. Bars represent standard deviation of mean values. *,†, p < 0.05 considered significant in Bonferroni multiple comparison, One-Way ANOVA test. *, control vs. HM-LF-LV diet fed mice, †, 2 weeks vs. 4 and 6 weeks. Data analyzed from five independent experiments (n = 5).