
Figure 4.
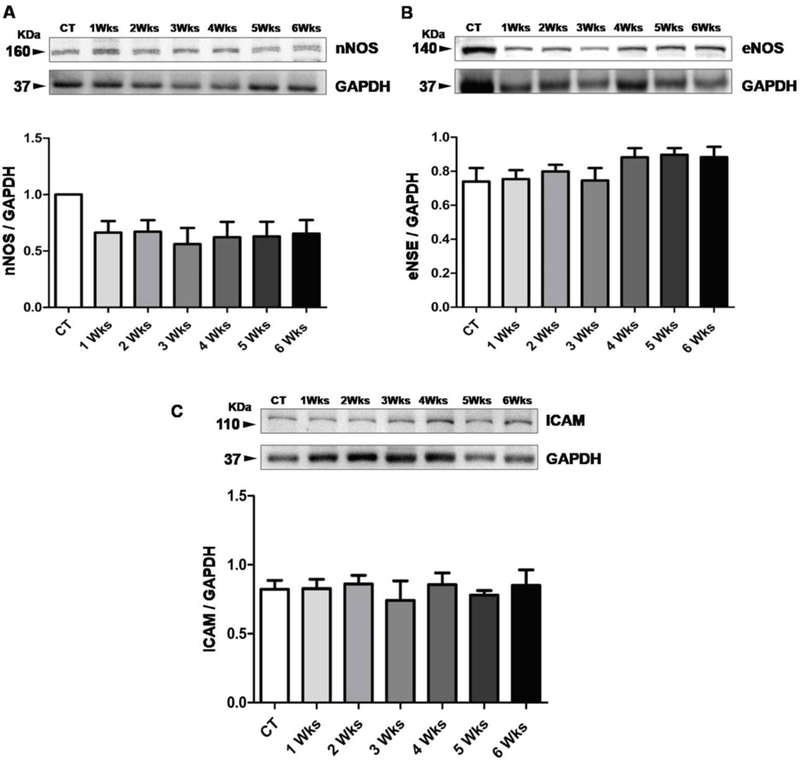
Representative data of NOS Regulation and vascular inflammation. (A-B) Comparative western blot analysis of regulation of nNOS and eNOS in control mice and experimental mice fed with HM-LF-LV diet. (C) Comparative western blot analysis of ICAM protein for the detection of vascular inflammation in normal fed control mice and experimental mice fed with HM-LF-LV diet. Bars represent standard deviation of mean values. *, p < 0.05 considered significant in Bonferroni multiple comparison, One-Way ANOVA test. *, control vs. HM-LF-LV diet fed mice. Data analyzed from five independent experiments (n = 5).