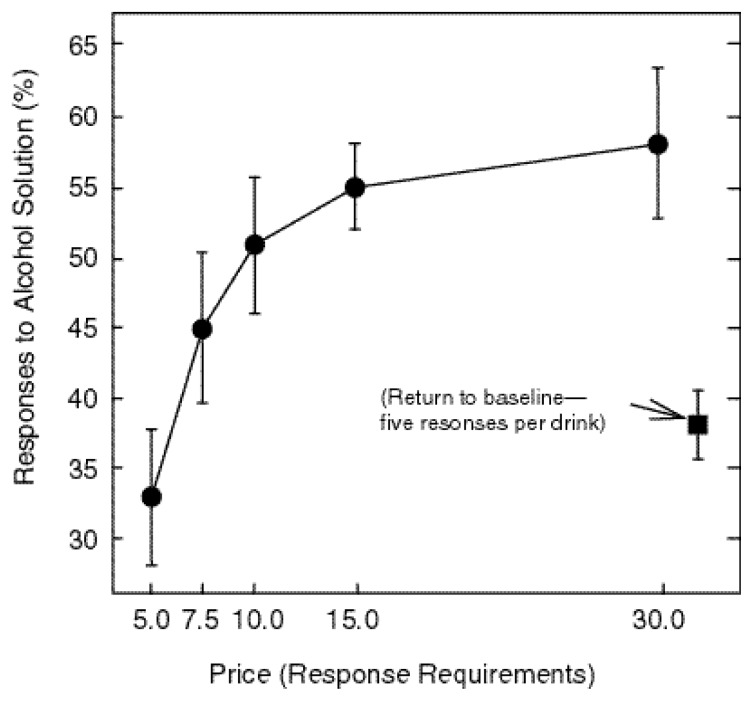
Figure 2.
Preference for the alcohol solution as a function of “price” change among study rats. The x-axis displays the response requirement and the y-axis displays the proportion of responses at the alcohol lever. The data points show the average response of seven rats during the final three sessions of each condition.

