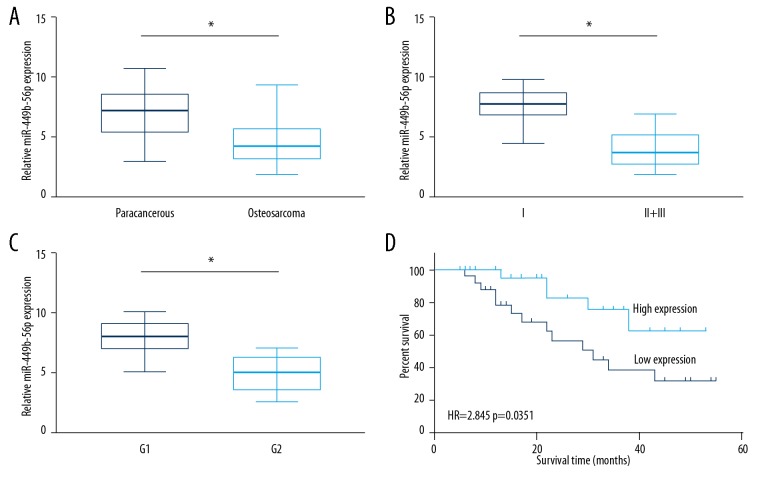
Figure 1.
Downregulated miR-449b-5p in OS. (A) Relative levels of miR-449b-5p in OS tissues and paracancerous tissues. (B) Relative levels of miR-449b-5p in OS patients in stage II+III and stage I. (C) Relative levels of miR-449b-5p in OS patients in G1 and G2. (D) Kaplan-Meier curves showing overall survival of OS patients with high and low levels of miR-449b-5p.

