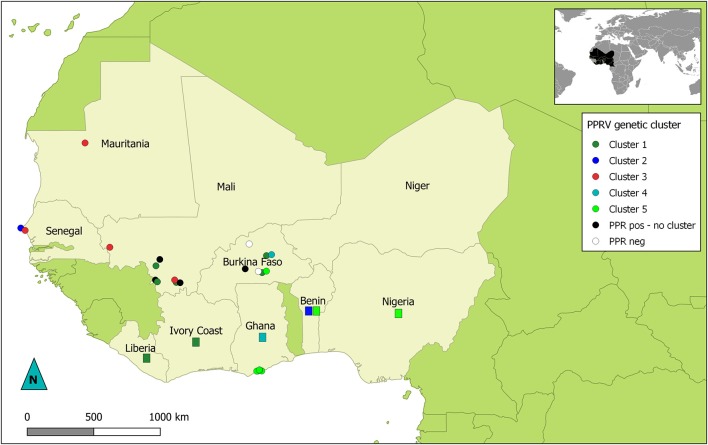
Figure 2.
Map of West Africa showing sampling location according to their PPRV lineage II genetic cluster. Dots represent location of samples obtained for this study. Rectangles indicate countries of origin for publically available sequence data used in this study and belonging to genetic clusters of interest in this study. Dots and rectangles are colored according to the genetic cluster (C1 to C5) they were placed in by phylogenetic analysis (see Figure 1). Black dots represent PPRV positive samples with no specified genetic cluster. White dots indicate sampling sites where no PPRV positive samples were obtained.

