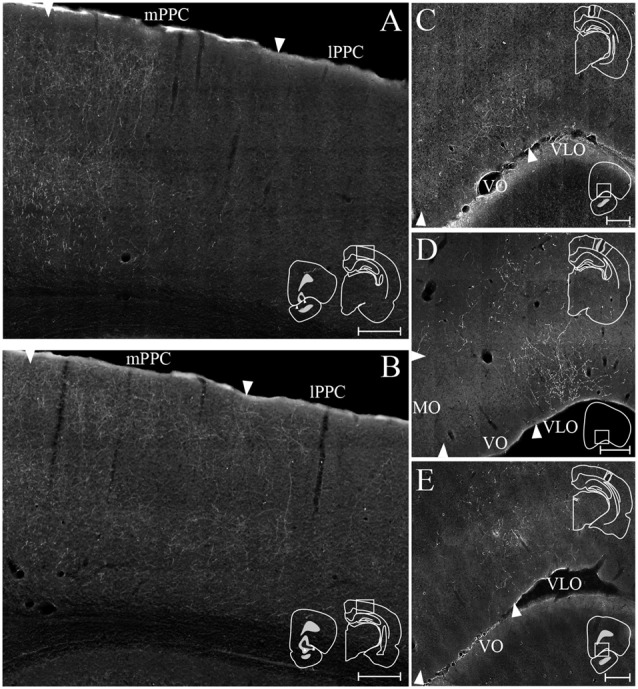
Figure 11.

OFC-PPC connections. (A,B) Examples of labeled fibers in PPC resulting from injections of anterograde tracer in VO (A, BDA) and VLO (B, PHA-L). Insets indicate the position of the injection site in OFC with the borders of VO (A) and VLO (B) marked by arrowheads (left) and the portion of PPC containing the labeled fibers (right). (C–E) Examples of labeled fibers in OFC resulting from injections of anterograde tracer in mPPC (C, BDA), lPPC (D, PHA-L), and PtP (E, BDA). Insets indicate the position of the injection site in PPC with the borders of mPPC (C), lPPC (D), and PtP (E) outlined with solid lines (top) and the position in OFC of the depicted area (bottom). Arrowheads indicate borders of cortical areas. All scale bars: 200 μm.
