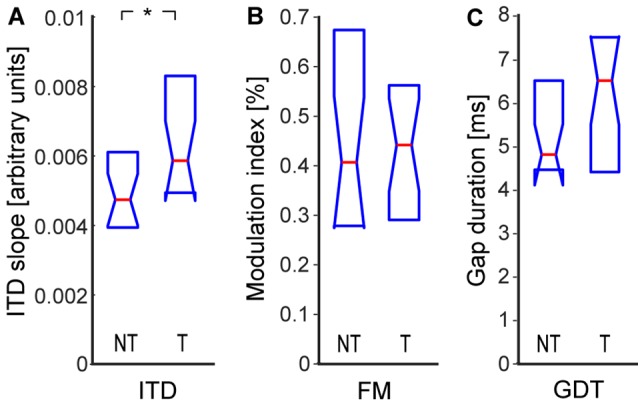
Figure 4.

Sensitivity to temporal parameters: interaural time delay (ITD) sensitivity (A), sensitivity to frequency modulation (FM; B), gap detection threshold (GDT; C). Medians and IQR. Statistically significant difference denoted with asterisk (Wilcoxon rank-sum tests; *p < 0.05).
