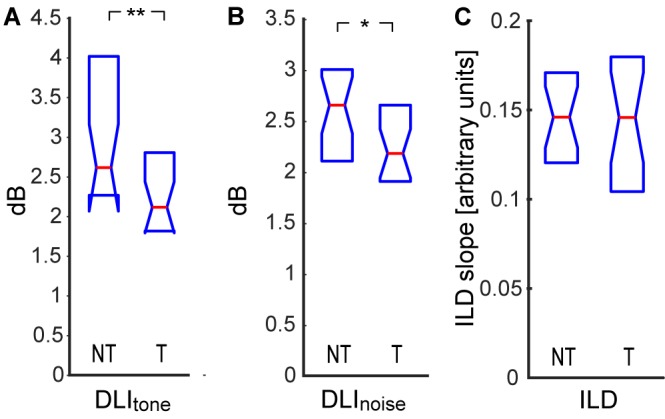
Figure 5.

Difference limen for intensity (DLI) of tone in noise (A), DLI of noise (B), sensitivity to interaural level difference (ILD; C). Medians and IQR. Statistically significant difference denoted with asterisks (Wilcoxon rank-sum tests; *p < 0.05; **p < 0.01).
