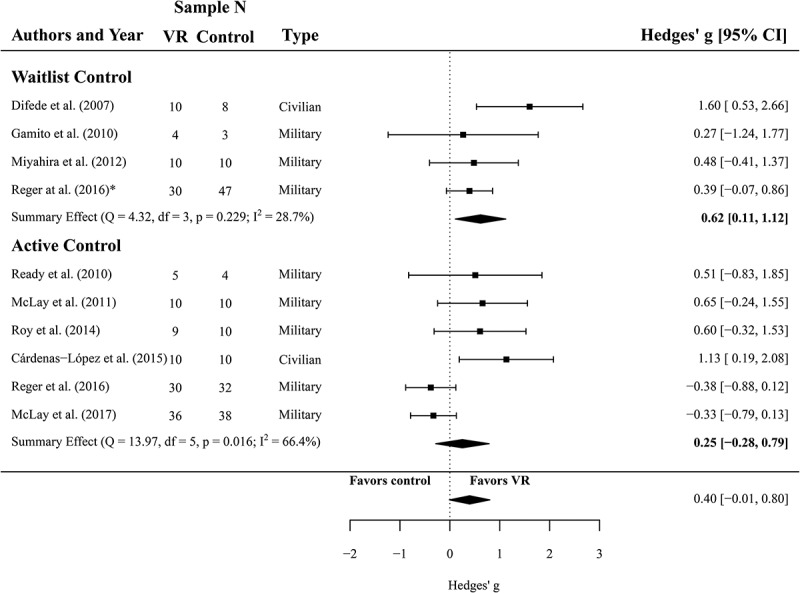
Figure 2.

Forest plot of the standardized mean difference (Hedges’ g) in post-treatment CAPS scores of VR treatments compared to control conditions (waitlist and active control). A positive effect size indicates that the outcome was in favour of VR treatment. Average effect was calculated using a random-effects model.
