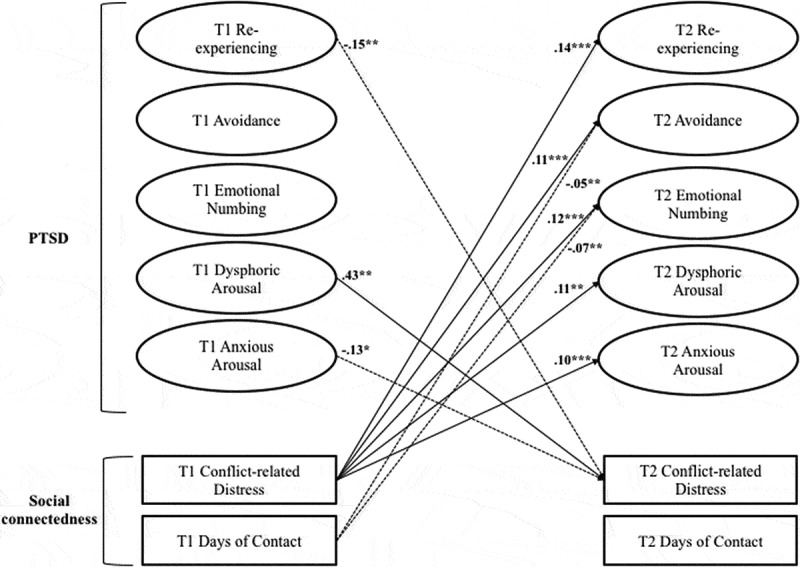
Figure 1.

Cross-lagged path model for PTSD five-factor model symptom clusters (PCL; Weathers et al., 1993) and social connectedness (BAM; Cacciola et al., 2013). Coefficients are standardized. T1 = Time 1, Baseline. T2 = Time 2, 4 months post-discharge. Only statistically significant cross-lagged paths are presented. *p < .05. **p < .01. ***p < .001. Solid lines denote positive prospective paths. Dashed lines denote negative prospective paths. Autoregressive pathways coefficient range = 0.25–0.48, all p’s < .001 (see SI Table 1). Symptom-level analyses are presented in SI Tables 4–5.
