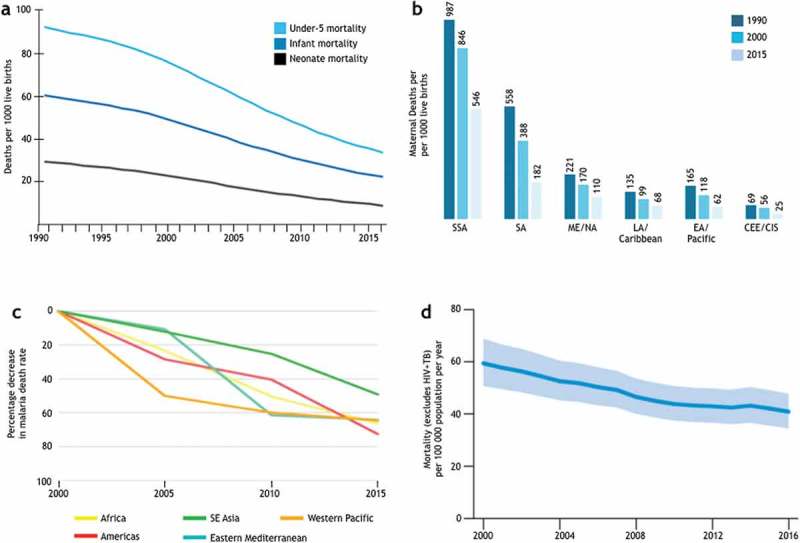
Figure 2.

Achievements in meeting the health-related MDGs. (a) Trends in the global under-5 (top), infant (middle), and neonatal (bottom) mortality rates. Adapted from [5]. (b) Maternal deaths per 100,000 live births in women aged 15–49. CEE, Central and Eastern Europe; CIS, the Commonwealth of independent states. Adapted from [6]. (c) Percentage decrease in malaria death rate since 2000 (by WHO region) [7]. (d) Mortality associated with TB in the WHO African region between 2000 and 2016 [8].
