Figure 2.

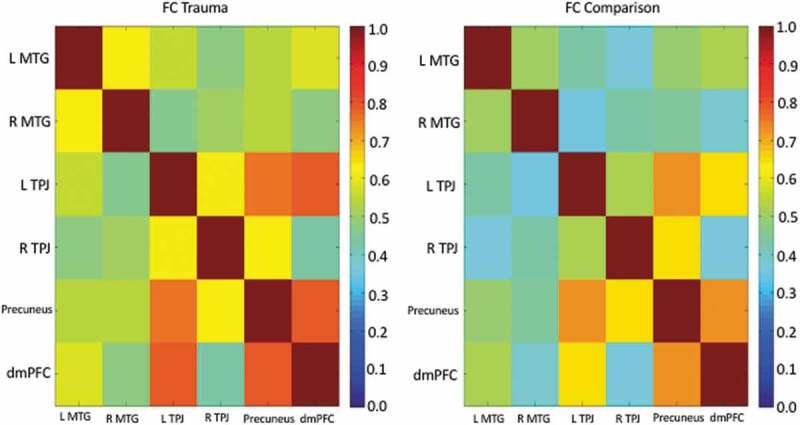
Correlation matrix (correlation coefficient, r) for the ToM to ToM region-of interest correlations for the trauma group (CA, left panel) and unaffected comparison group (UC, right panel) separately.

Correlation matrix (correlation coefficient, r) for the ToM to ToM region-of interest correlations for the trauma group (CA, left panel) and unaffected comparison group (UC, right panel) separately.