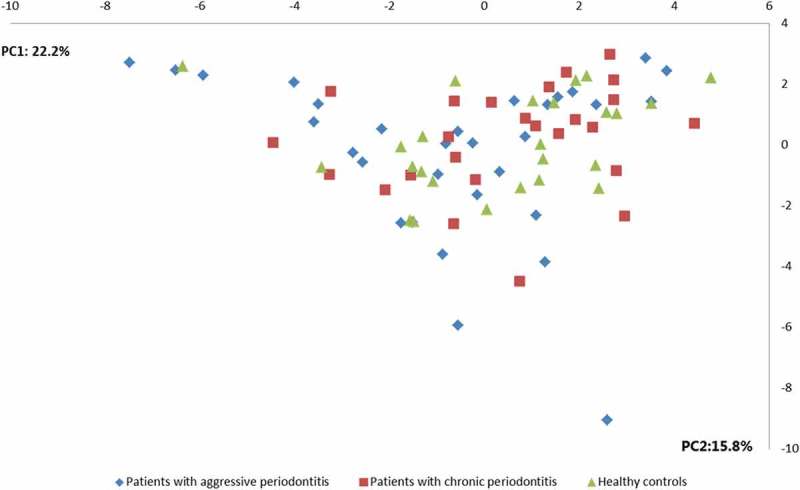
Figure 2.

Principal component analysis. Principal component analysis visualized two-dimensionally with axes expressed as two principal components values accounting for a cumulative value of (38.0%). Sample denotation: aggressive periodontitis patients: blue, chronic periodontitis patients: red, healthy controls: green.
