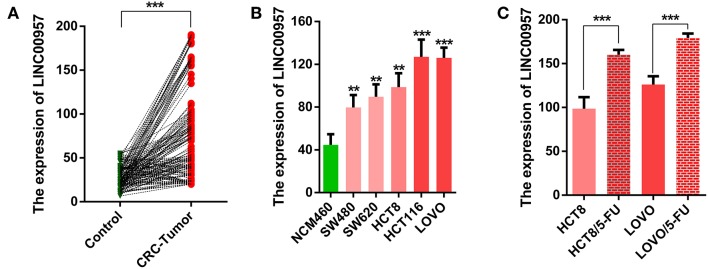
Figure 2.
The relative expression level of LINC00957 in tissue samples and cell lines. (A) The green points represented normal tissues as control, while the red stood for CRC. A line connects two pionts (the expression levels of LINC00957 shown in (A) from non-tumor to CRC with an increased trend, suggesting that the expression level of LINC00957 was higher in CRC tissues than in the matched non-tumor tissues. (B) Expression levels of LINC00957 in CRC cell lines including (SW480,SW620,HCT8,LOVO, and HCT116) and the normal human colon epithelial cell line NCM460 was measured by qRT-PCR. (C) The relative expression levels of LINC00957 in CRC cell lines and their matched 5-FU resistant cell lines were detected by qRT-PCR. **P < 0.01, ***P < 0.001.

