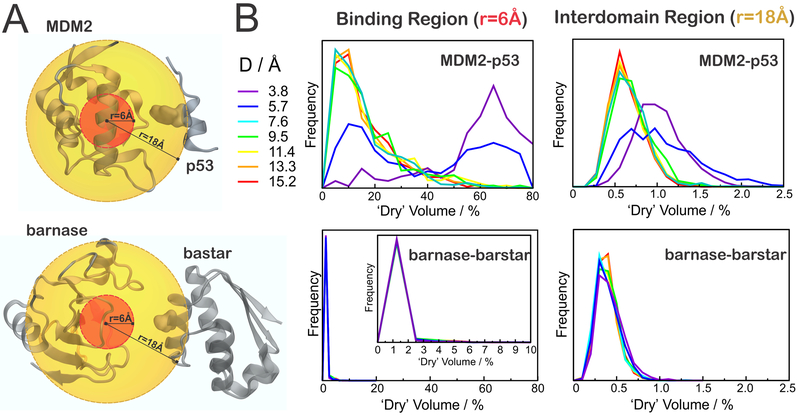
Figure 4.
Desolvation in the binding region and interdomain gap. (A) Regions considered in the analysis, defined by spheres of radius 6 Å (red) or 18 Å (orange), illustrated for D = 9.5 Å. (B) Distribution of “desolvated” volumes, calculated as in eq 2, for MDM2–p53 (top) or barnase–barstar (bottom), in the binding regions (left) or in the interdomain gap (right).

