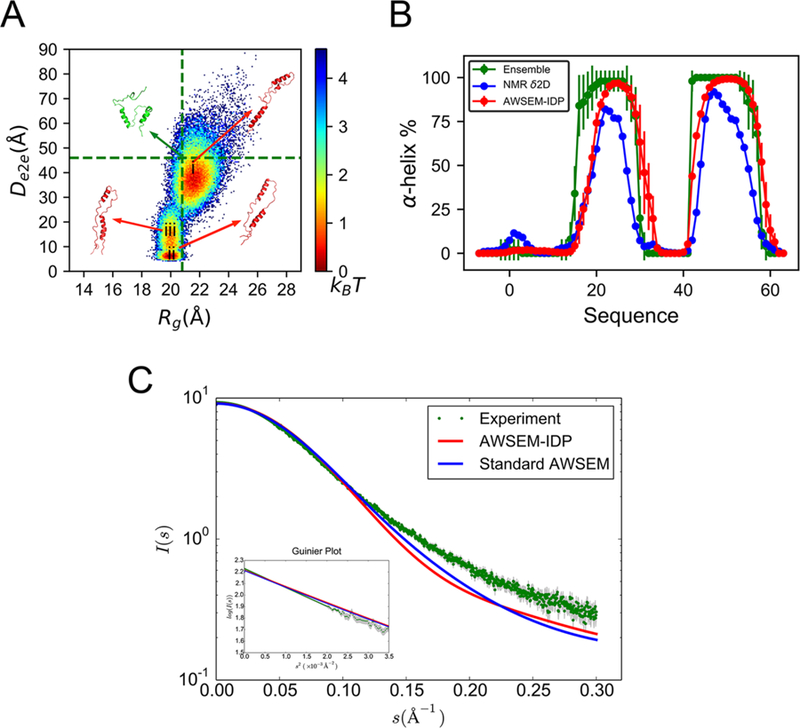
Figure 5.

AWSEM-IDP simulations agree well with experiments in the global and local structures of PaaA2. (A) The free energy landscape of PaaA2 is projected on the coordinates of Rg and De2e. The vertical and horizontal lines in the figure are the average Rg and De2e from the experimental ensemble calculated on the basis of NMR and SAXS data in Sterckx et al.63 Representative structures are shown for the experimental ensemble (green) and for different basins in AWSEM-IDP simulations (red). (B) The two helical structures in both experimental ensemble (green) and δ2D calculation from NMR chemical shifts data (blue) are well-replicated by AWSEM-IDP simulations (red), with similar positions and probabilities. (C) The AWSEM predicted SAXS curves and the related Guinier plot (inset figure). Experimental errors are labeled in gray.
