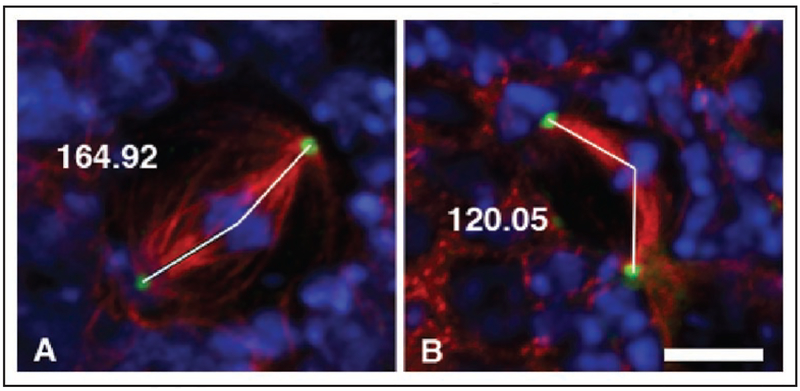
Figure 7.
Confocal images of wildtype (A) and zw3b12 hemizygous mutant neuroblasts (B) taken from fixed and immunostained whole-mount 3rd instar brains, and illustrating how spindle angle measurements were made to compile the data in Table 2 (See Materials and Methods). DNA is shown in blue, microtubules in red, and centrosomes in green. Lines were drawn from each centrosome to the center of the chromosome mass, and the angle measured. Scale bar is 5 μm.

