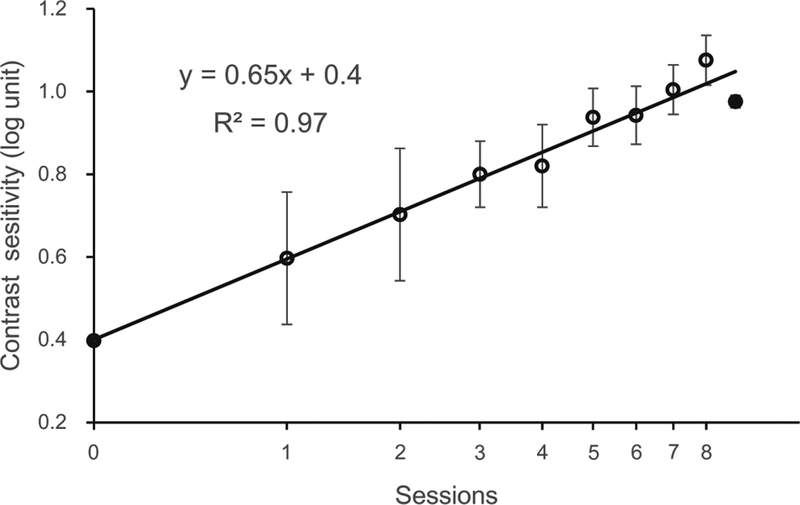
Figure 4.
Average learning curve. The first and last data points (filled circles) were derived from pre-training and post-training CSF measurements, respectively. Data from the training phase are represented by open circles. The number of training sessions varied between observers, from 6 to 10 (9.2 ± 1.1 SD) sessions (only one observer trained for 6 sessions). We illustrated eight common sessions for all but one subjects here. Data were fitted with a linear function with a slope of 0.65 and r2 of 0.97 (p < 0.01). Error bars represent SEM.

