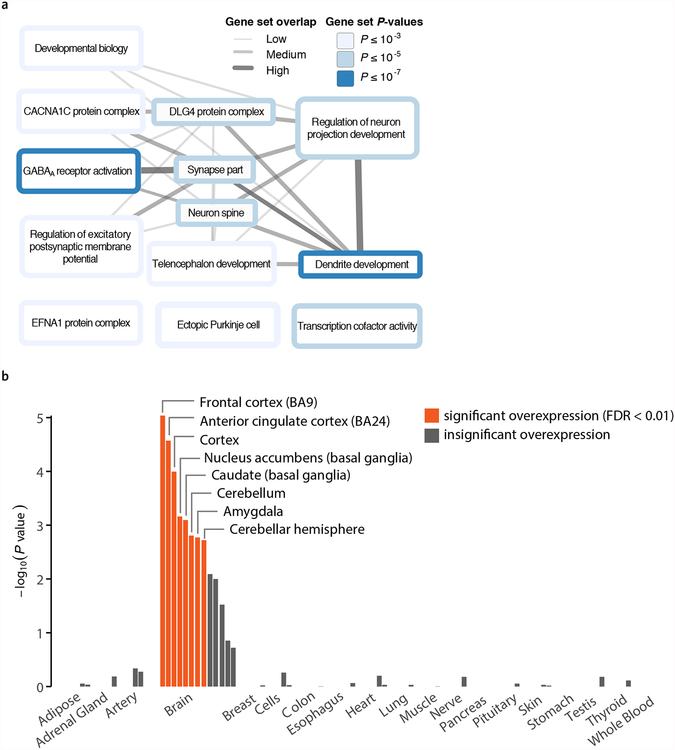
Figure 3 |. Results from selected biological analyses.
a, DEPICT gene-set enrichment diagram. We identified 93 reconstituted gene sets that are significantly enriched (FDR < 0.01) for genes overlapping DEPICT-defined loci associated with general risk tolerance; using the Affinity Propagation method43, these were grouped into the 13 clusters displayed in the graph. Each cluster was named after its exemplary gene set, as chosen by the Affinity Propagation tool, and each cluster’s color represents the permutation P value of its most significant gene set. The “synapse part” cluster includes the gene set “glutamate receptor activity,” and several members of the “GABAA receptor activation” cluster are defined by gamma-aminobutyric acid signaling. Overlap between the named representatives of two clusters is represented by an edge. Edge width represents the Pearson correlation ρ between the two respective vectors of gene membership scores (ρ < 0.3, no edge; 0.3 ≤ ρ < 0.5, thin edge; 0.5 ≤ ρ < 0.7, intermediate edge; ρ ≥ 0.7, thick edge). b, Results of DEPICT tissue enrichment analysis using GTEx data. The panel shows whether the genes overlapping DEPICT-defined loci associated with general risk tolerance are significantly overexpressed (relative to genes in random sets of loci matched by gene density) in various tissues. Tissues are grouped by organ or tissue type. The orange bars correspond to tissues with significant overexpression (FDR < 0.01). The y-axis is the significance on a −log10 scale. See Supplementary Note for additional details.

