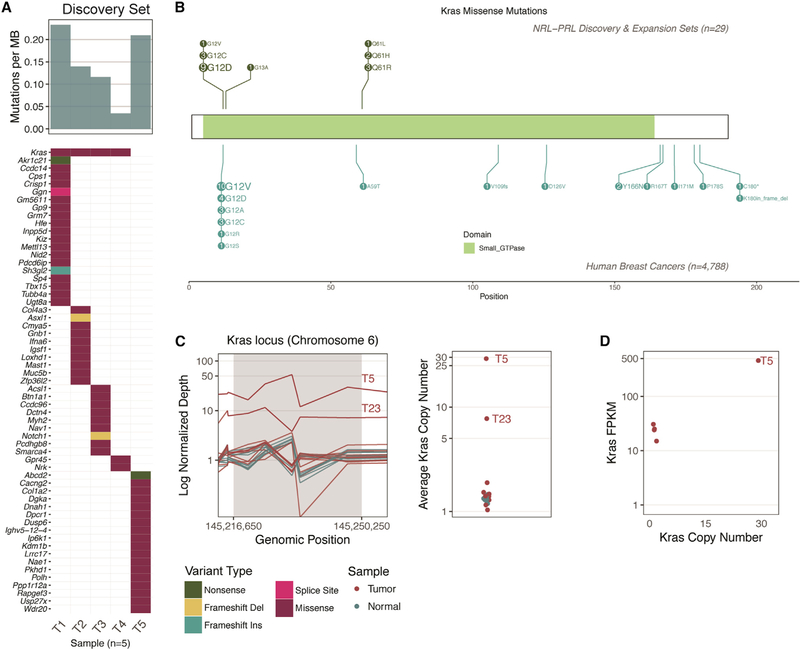
Figure 3. Summary of Kras Modifications in NRL-PRL Tumors.
(A) The mutation frequency ranged from 3–20 nonsynonymous coding mutations across the five tumors in the discovery set (median, 12; top bar chart). The mutation burden (mutations per megabase) is shown. The only recurrently mutated gene in our cohort was Kras (top row of the bottom plot). The waterfall plot indicates the types of mutations detected in the remainder of the cohort (as detailed in the legend below C).
(B) Schematic of all mutations, comparing the prevalence of Kras missense mutations in tumors in NRL-PRL mice (n = 29; 20 contained Kras missense mutations) with KRAS missense mutations in human breast cancer: The Cancer Genome Atlas [TCGA], n = 825; METABRIC, n = 2,056; Lefebvre et al. (2016), n = 216; Stephens et al. (2012), n = 100; Banerji et al. (2012), n = 103; Griffith et al. (2018), n = 1,038.
(C) Left: Normalized depth of sequencing (coverage normalized by respective sample total sequencing depth) over the exons spanning the Kras gene locus (in 320- to 920-bp windows) of all tumor and normal samples. Tumor samples are not normalized with respect to matched normal data because matched normal tails were not available for all mice. Right: the average depth of sequencing (all windows) within the Kras locus is indicated on a log2 scale. Amplifications detected in T5 and T23 are labeled.
(D) RNA-seq data were available for T1–T5 (discovery set). The copy number (right panel, C) of Kras is plotted along the x axis, and the gene expression of Kras (in fragments per kilobase transcript per million mapped reads [FPKM]; quantified by Cufflinks, see STAR Methods) is indicated on the y axis. Note, two points nearly overlap. Refer to Figures S1 and S2 and Table S3 for further details.

