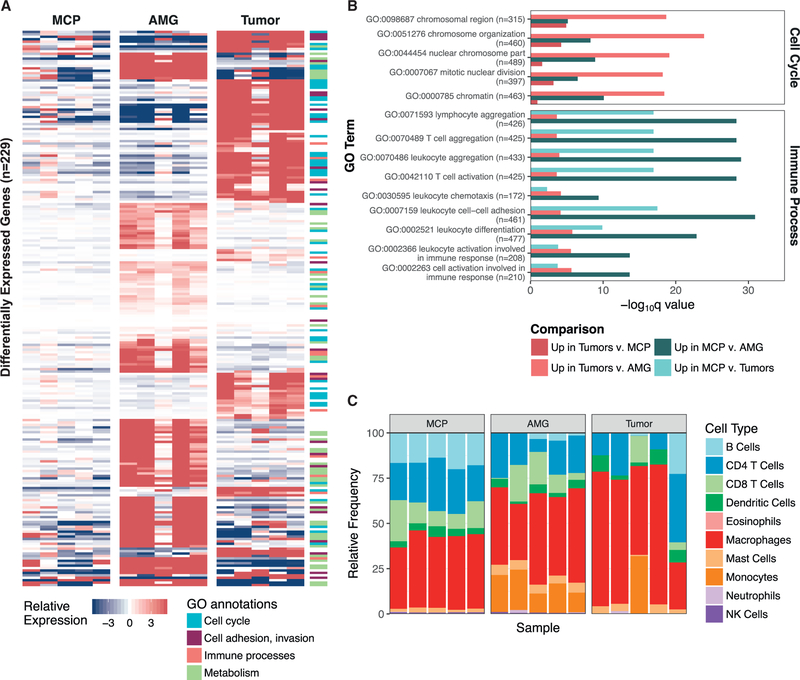
Figure 5. Tumorigenic Processes Differ across Stages of Disease Progression.
(A) Supervised differential expression analysis was performed on all comparisons of nondysplastic MCPs (n = 5), AMGs, and end-stage tumors (n = 5) from the discovery set. Genes that were significantly upregulated (p < 0.0001) in either tumors (compared with AMGs and MCPs) or glands (compared with tumors and MCPs) that were also annotated within significantly upregulated GO annotations (p < 0.001) are shown in the heatmap (n = 229). Fill indicates the gene-median centered expression value, calculated with respect to the entire discovery set. GO annotations were grouped into cellular processes, and genes corresponding to each annotation are noted in the side color bar (STAR Methods).
(B) A representative set of differentially expressed GO processes, categorized as “Cell Cycle” and “Immune Processes” in (A), are displayed based on their q value. Following each GO process, the number of genes included in the annotation is indicated. Comparisons are summarized as those that were upregulated in either MCPs or tumors compared with the other sample types.
(C) seq-ImmuCC was used to predict the relative proportions of immune cell populations (y axis) in MCPs, AMGs, and end-stage tumors from the discovery set. Samples are ordered by identifier (MCP A–E, AMG 1–5, and Tumors 1–5).

