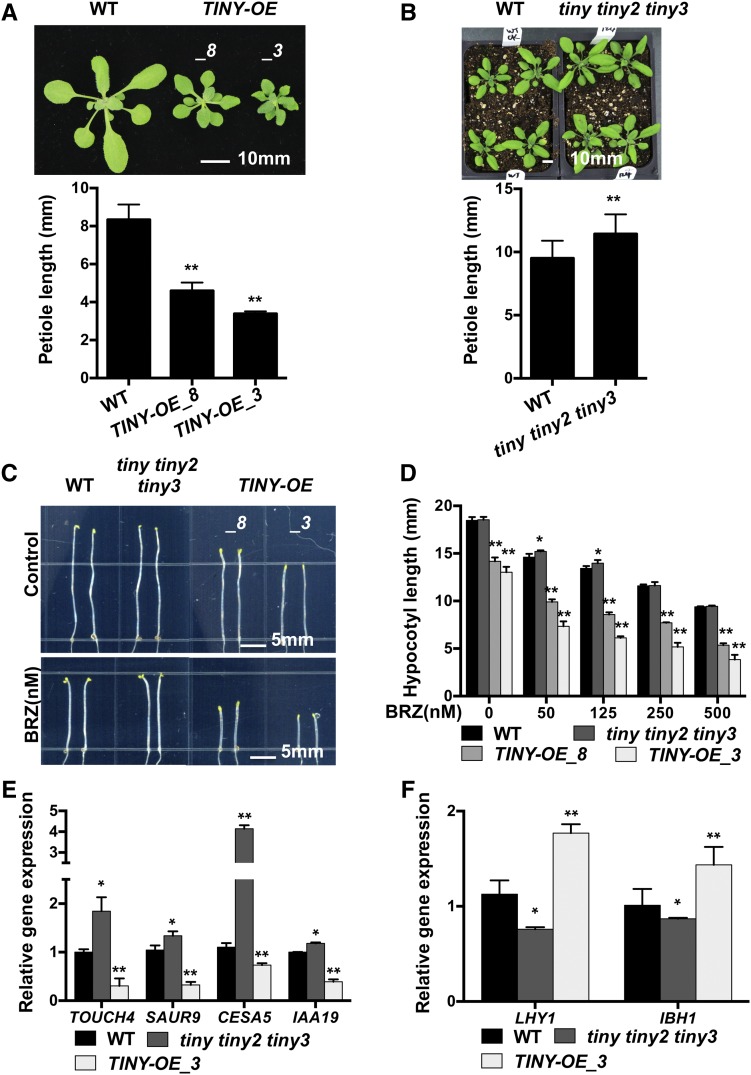
Figure 1.
TINY Negatively Regulates Plant Growth by Inhibiting the BR Pathway.
(A) Growth phenotype of the 4-week-old wild-type (WT) and TINY-OE (lines 3 and 8) plants. The sixth leaves of plants were measured for petiole length. Data represent mean and sd, n = 30 to 36. *P < 0.05, **P < 0.01; Student’s t test.
(B) Phenotype of the 4-week-old wild-type (WT) and tiny tiny2 tiny3 plants. Data represent mean and SD, n = 15 to 22.
(C) and (D) BRZ sensitivity of TINY-OE and tiny tiny2 tiny3 plants. Seven-day-old seedlings were grown on 1/2 LS medium with 250 nM BRZ in dark (C). Hypocotyl was measured using ImageJ (D). Data represent mean and sd from three biological replicates (n = 3); each replicate contained 12 to 15 seedlings. *P < 0.05, **P < 0.01; two-way analysis of variance. WT, wild type.
(E) and (F) BR-regulated gene expression in TINY mutants. mRNA was extracted from 4-week-old plants for BR-induced genes (E) and BR-repressed genes (F) expression analysis. Data represent mean and sd from three biological replicates (n = 3). Each biological replicate was pooled tissue from three to four individual plants. *P < 0.05, **P < 0.01; Student’s t test.

