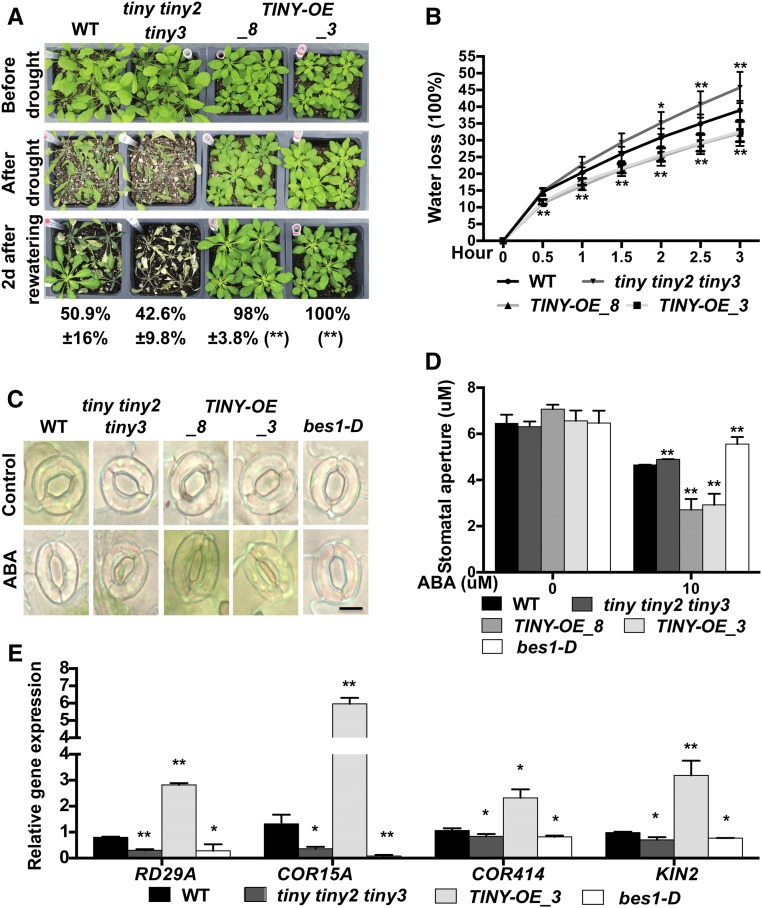
Figure 3.
TINY Positively Regulates Drought Responses.
(A) Plant phenotypes for indicated genotypes after drought recovery assays. Phenotype of plants before drought (top), after drought (middle), and 2 d after rewatering (bottom). The survival rate after recovery was determined (bottom). Data represent mean and sd from four individual tray results (n = 4). Each genotype per tray contained 20 to 25 plants. **P < 0.01; two-way analysis of variance. WT, wild type.
(B) Detached leaf water loss assays. Leaves with similar developmental stages were detached and weighed at the indicated time. Water loss represents proportion of total weight lost compared with initial weight. Data represent mean and sd from four to five biological replicates (n = 4 to 5). Each replicate contained 10 to 15 leaves. *P < 0.05, **P < 0.01; two-way analysis of variance. WT, wild type.
(C) Representative stomata images of indicated genotypes. Epidermal peels of indicated genotypes were treated under light for 3h to make sure all stomatal were opened, then the peels were treated with or without 10 μM ABA for 3 h . Bars = 10 μm. WT, wild type.
(D) Stomatal apertures of indicated genotypes. Data represent mean and sd from three individual biological replicates (n = 3). Each replicate quantified 50 to 60 stomata from three individual leaves. *P < 0.05, **P < 0.01; two-way analysis of variance. WT, wild type.
(E) Drought-responsive gene expression levels in TINY mutants. mRNA was extracted from 4-week-old plants for gene expression analysis. Drought-responsive genes inculded RESPONSIVE TO DESICCATION 29A (RD29A), COLD REGULATED 15A (COR15A), COLD REGULATED 414 (COR414) and KINASE 2 (KIN2). Data represent mean and sd from three biological replicates (n = 3). *P < 0.05, **P < 0.01; Student’s t test.

