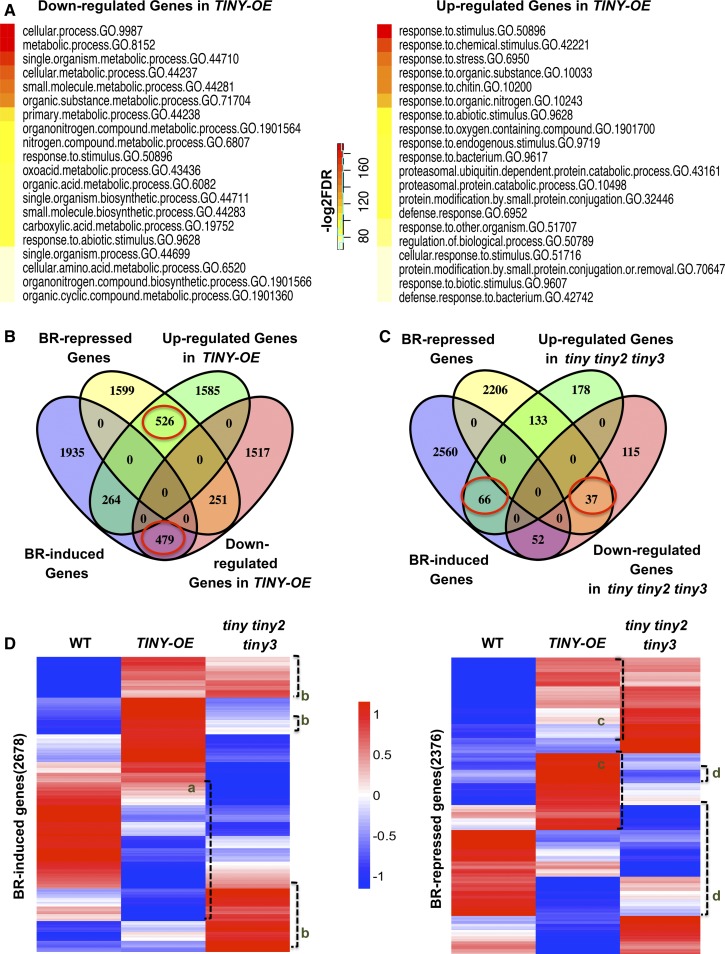
Figure 4.
TINY Regulation on BR-Responsive Genes.
(A) List of the top 20 significant enriched GO terms about DEGs in TINY-OE as ranked by false discovery rate.
(B) and (C) Venn diagrams showing overlap among BR-regulated genes and DEGs in TINY-OE (B) and tiny tiny2 tiny3 (C) from QuantSeq. Red circle indicates genes differentially regulated by TINY and BR.
(D) Clustering analysis of genes defferential expressed in TINY-OE and tiny tiny2 tiny3. The color legend indicates normalized gene expression value among genotypes. Cluster a indicates BR-induced genes downregulated in TINY-OE, cluster b indicates BR-induced genes upregulated in tiny tiny2 tiny3 mutant. Cluster c indicates BR-repressed genes upregulated in TINY-OE, cluster d indicates BR-repressed genes downregulated in tiny tiny2 tiny3 mutant. WT, wild type.

