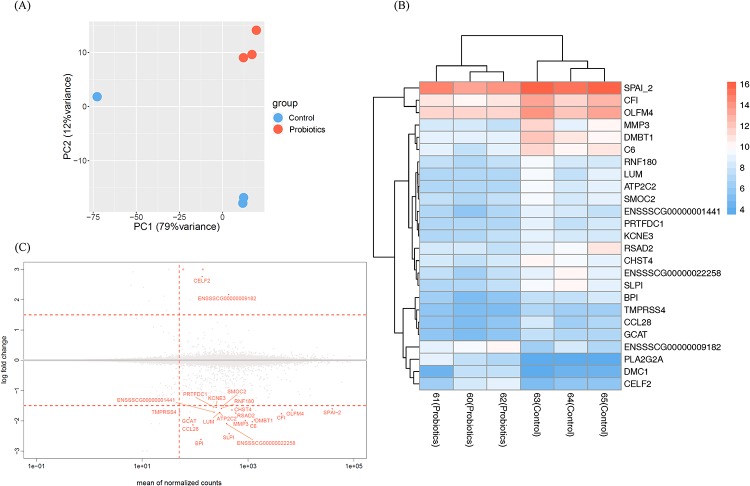
Fig 6. Expression pattern comparative analysis between the control and probiotics piglets.
(A) Principal component analysis (PCA) plot between the control and probiotics RNA-seq samples. (B) Heatmap of DEGs distinguishes the control and probiotics piglets. The color scale represents a low expression value in blue and a high expression value in red. (C) Expression of DEGs between control and probiotics piglets.

