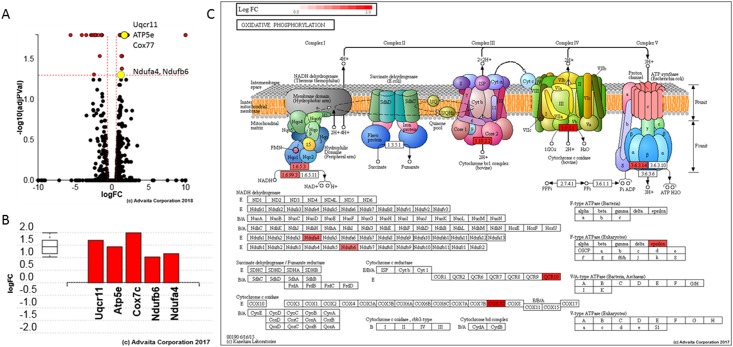
Fig 6. Hltf regulates OXPHOS.
A. Volcano plot. Differential expression (DE) of ATP5e, Cox7c, Uqcr11, Ndufa4 and Ndufb6 is the measured expression of change (x-axis) and the significance of the change (y-axis). Groups of genes represented by a single yellow dot share the same change in gene expression compared to their matched controls. Significance is the negative log (base 10) of the p-value, and the most significant changes are plotted higher on the y-axis. The dotted lines represent the thresholds used to select the DE genes: LogFC = 0.6 for expression change and 0.05 for significance (p-value shown in terms of the negative log (base 10) value). B. Gene perturbation bar plot. All the genes in OXPHOS (KEGG: 00190) are ranked based on their absolute perturbation values. The box and whisker plot on the left summarizes the distribution of all the differentially increased genes annotated to this pathway. The box represents the 1st quartile, the median and the 3rd quartile. C. OXPHOS (KEGG: 00190) pathway diagram is overlaid with the computed perturbation of each gene. Perturbation accounts for a gene’s measured fold change and for the accumulated perturbation propagated from any upstream genes (accumulation). The highest positive perturbation is in dark red. Genes are highlighted in all locations in the diagram.

