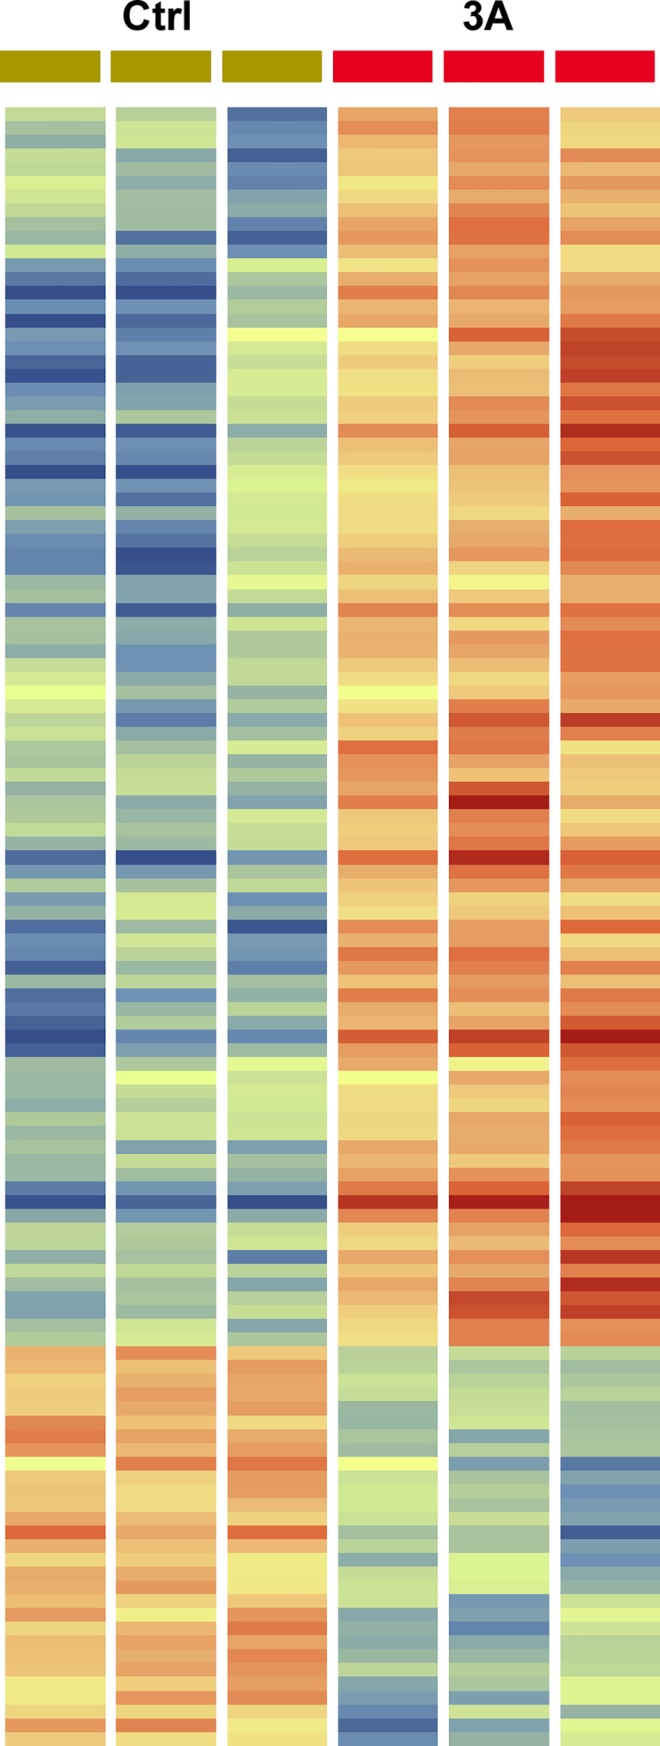
Fig 4. Heatmap showing gene expression changes in control (ctrl) versus Cd2ap+/-, Fyn-/- three allele mutant (3A) podocytes.

There were three samples of each, with red indicating stronger expression and blue indicating weaker expression. Genes with greater than 2 fold change are shown. An expandable version including gene names is included in supplementary data (S1 Fig). Lists of genes with fold change are included in S1 Table.
