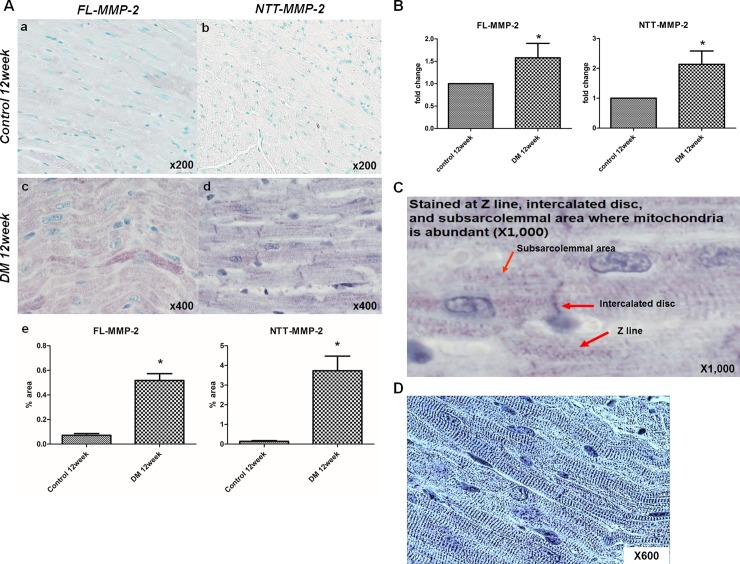
Fig 5. High resolution analysis of MMP-2 isoform staining, and real-time quantitative PCR analysis.
(A) Optical microscopic findings. The expression of the two MMP-2 isoforms as determined by immunohistochemistry (IHC; Original magnification x200, x400). a, b: The expressions of both isoforms were minimal in control mice. c, d: FL-MMP-2 staining showed FL-MMP-2 was mainly localized at sarcomeres, while NTT-MMP-2 staining shows NTT-MMP-2 was localized at Z- lines, nuclei, and subsarcolemmal areas in diabetic mice (longitudinal section). e: Quantitative analysis of both isoforms staining shows significantly increased staining of both MMP-2 isoforms in diabetic group compared to control group. (B) Real-time quantitative PCR of the two isoforms of MMP-2 in control and diabetic mouse hearts. FL- and NTT-MMP-2 isoform transcripts were upregulated strongly in diabetic heart tissues. (C) High resolution (x1000) images showed that NTT-MMP-2 expressed the specific area within cardiac muscle cells such as Z-line, intercalated disc and subsarcolemmal area where the mitochondria are abundant (red arrows). (D) In contrast conversed image, these findings could be identified (blue lines) consistent with the previous results (18,19,22).

