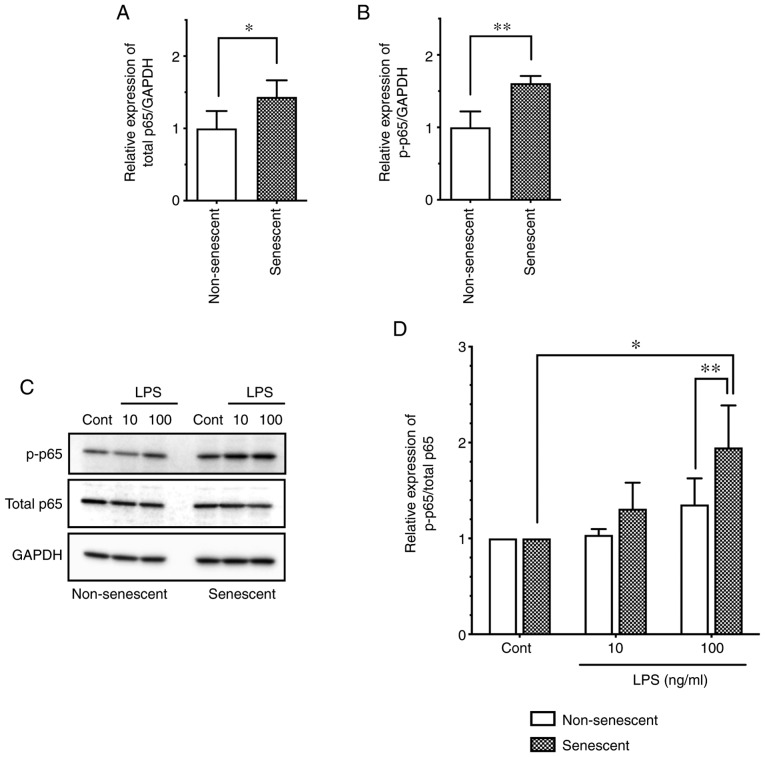
Figure 3.
Basal and LPS-stimulated levels of NF-κB p65 in senescent and non-senescent endothelial cells. (A) The expression levels of total p65 and (B) p-p65 were analyzed in senescent and non-senescent HUVECs by western blotting. Relative expression was normalized to GAPDH and presented as relative to non-senescent cells. Data are presented as the mean ± SD of six independent experiments. (C) Senescent or non-senescent HUVECs were incubated with LPS (10 or 100 ng/ml) for 1 h. The protein expression levels of total and p-p65 were analyzed by western blotting. (D) Relative expression of p-p65/total p65 was expressed as a ratio to control untreated cells. Data are presented as the mean ± SD of four independent experiments. *P<0.05 and **P<0.01, with comparisons indicated by lines. LPS, lipopolysaccharide; p-, phosphorylated; HUVECs, human umbilical vein endothelial cells; Cont, control.

