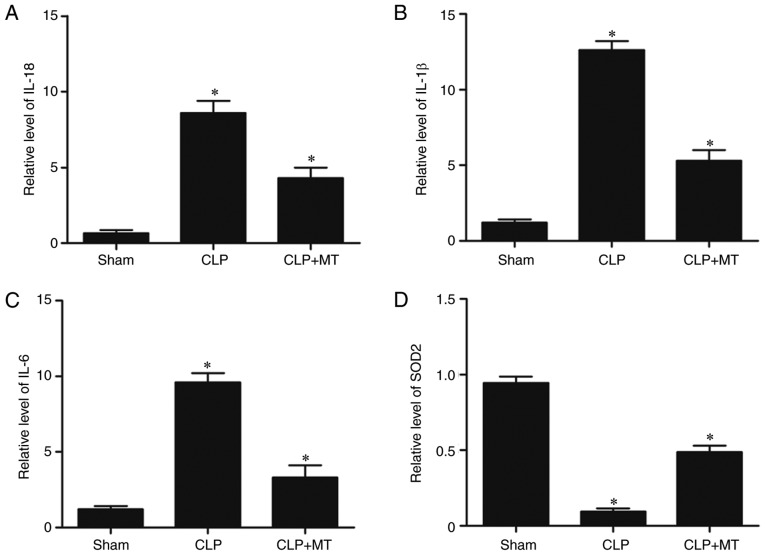
Figure 6.
ELISA was used to compare protein levels of IL-18, IL-1β and IL-6 among the sham, CLP, and CLP + MT groups (one-way analysis of variance, *P<0.05, compared with the control). (A) Protein level of IL-18 was highest in the CLP group and lowest in the sham group. (B) Protein level of IL-1β was highest in the CLP group and lowest in the sham group. (C) Protein level of IL-6 was highest in the CLP group and lowest in the sham group. (D) Protein level of SOD2 was lowest in the CLP group and highest in the sham group. CLP, cecal ligation and puncture; MT, melatonin; IL, interleukin; SOD2, superoxide dismutase 2.

