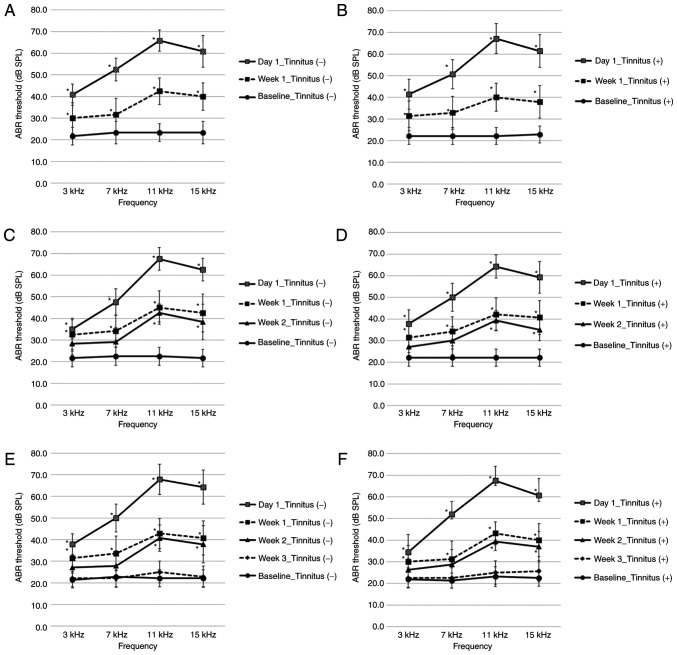
Figure 2.
ABR thresholds before and after noise exposure in the second section. (A) Week 1 non-tinnitus group; n=6. (B) Week 1 tinnitus group; n=7. (C) Week 2 non-tinnitus group; n=6. (D) Week 2 tinnitus group; n=7. (E) Week 3 non-tinnitus group; n=7. (F) Week 3 tinnitus group; n=8. Data are presented as the mean ± SD, as determined by one-way ANOVA followed by Tukey's post-hoc test. *P<0.05 vs. Baseline ABR threshold. ABR, auditory brainstem response; SPL, sound pressure level.

