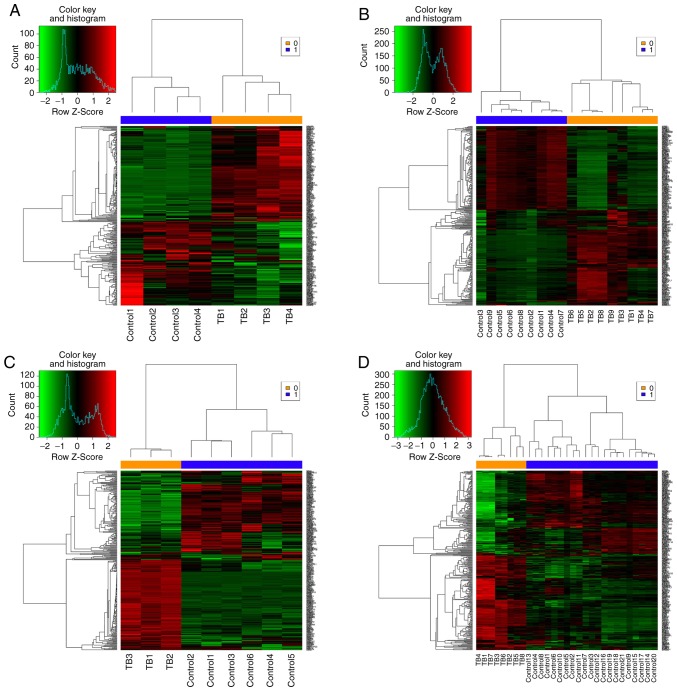
Figure 4.
Hierarchical cluster analysis of 306 differentially expressed genes in four high quality datasets. (A) GSE17477 dataset. (B) GSE51029 dataset. (C) GSE57028 dataset. (D) GSE89391 dataset. Each row represents mRNA and each column represents a sample. Red indicates higher expression in TB as compared with that in normal subjects. Green indicates low expression in TB compared to that in normal subjects. TB, THP-1 derived macrophages infected by Mycobacterium tuberculosis H37Rv strain; control, normal THP-1 derived macrophages.

