
Figure 8.
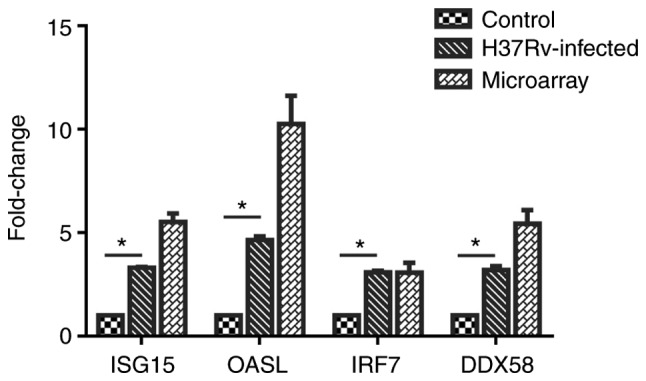
Expression levels of ISG15, OASL, IRF7 and DDX58. Validation is based on the expression levels in infected and uninfected cells, measured by reverse transcription quantitative polymerase chain reaction, and then compared with the microarray results. Experiments were performed in triplicate, *P<0.05 by ANOVA.