Figure 4.
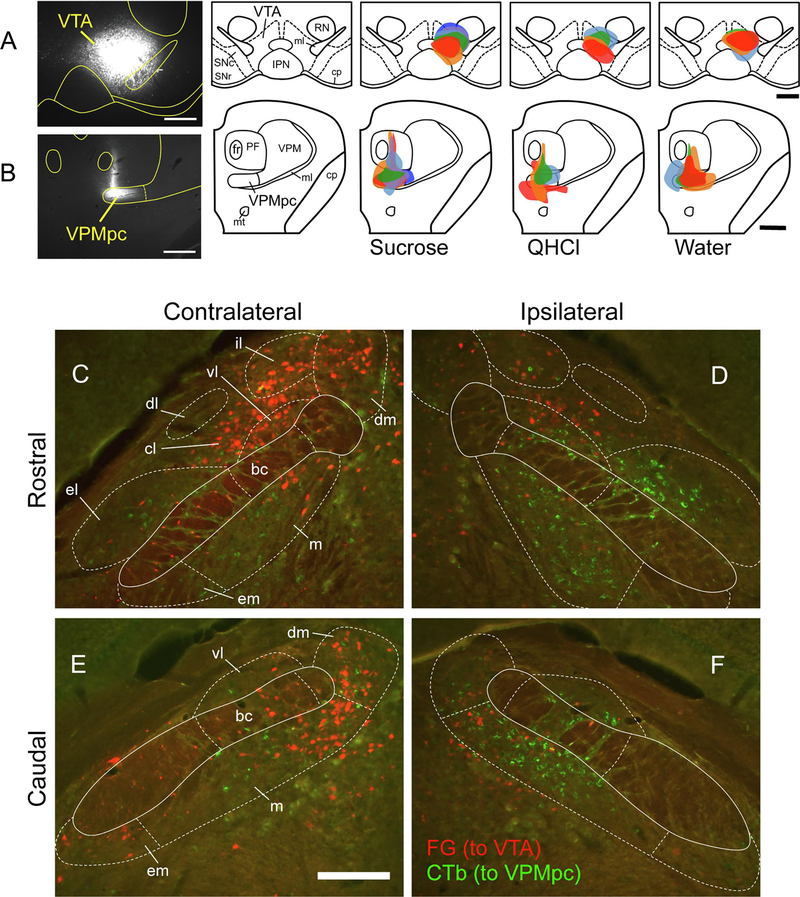
VTA and VPMpc injection sites, and neuronal cell body labeling in the PBN. A. Representative photomicrograph of VTA injection site, and plots of injection site and size in the VTA for each animal according to stimulus group. B. Representative photomicrograph of VPMpc injection site, and plots of injection site and size in the VPMpc for each animal according to stimulus group. Colors identify single animals within each group, consistent for injections at both brain sites. C-F: Tracer labeling in the PBN. Low-power (10X) Fluorescent images taken from both sides of 2 brain sections from a single mouse, with rostral (top) and caudal (bottom) levels of the PBN shown. Retrograde FG labeling (red) from the VTA was stronger on the contralateral side, whereas retrograde CTb labeling (green) was stronger on the ipsilateral side. In these images, Fos-IR cells are not shown. Scale bars: A-B = 500 μm, E = 200 μm.

