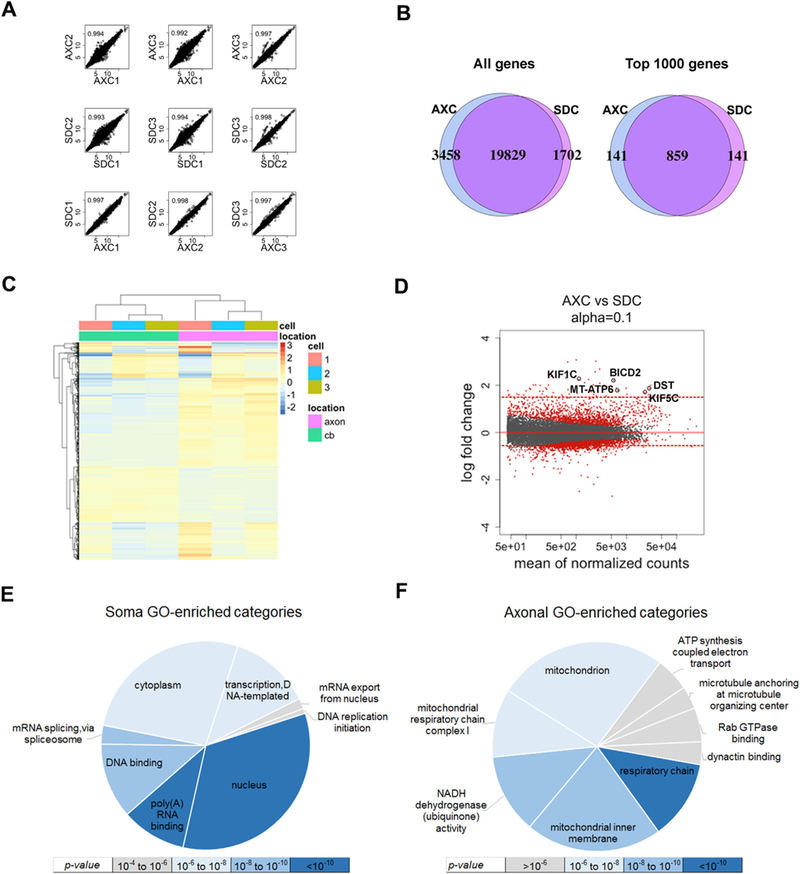
Fig. 2.

Transcriptome profiling of iPSC-derived motor neuron axonal and somatodendritic compartments (AXC and SDC). (A) Correlation analysis of regularized-log-transformed (rld) read counts for biological replicates (rows 1 and 2) and compartments derived (row 3) from each individual line (n = 3). The unit axes are rld read counts and the plots contain the Pearson correlation coefficient. (B) Venn diagrams displaying the total detectable genes (read count ≥ 1) in all3 biological replicates of each compartment (left), and the 1000 genes with the highest average read count of each compartment (right). (C) Unsupervised clustering of the top 1000 most significantly differentially localized genes, annotated with cell line number and subcellular compartment. The scale bar units are the row-average-normalized rld read counts. (D) MA-plot showing the log2 fold change between compartments (y-axis) versus the gene abundance (x-axis), highlighting significant genes in red (q ≤ 0.1). Red dotted lines represent thresholds fold change used for differentially localized transcripts (≥ 1.5 or fold change ≤ 0.5). Neurological disorders-and axonal transport-related genes are labeled (KIF1C, KIF5C, DST, BICD2 and MT-ATP6). (E & F) Gene Ontology enrichment analysis of differentially localized transcript sets colored by significance: (E) upregulated in soma (log fold-change ≤ 0.5 and q-value ≤ 0.1) and (F) upregulated in axon (log fold-change ≥ 1.5 and q-value ≤ 0.1). BICD2: bicaudal D homolog 2; DST: dystonin; KIF5C: kinesin family member 5C; MT-ATP6: mitochondrially encoded ATP synthase 6; KIF1C: kinesin family member 1C.
