Figure 5:
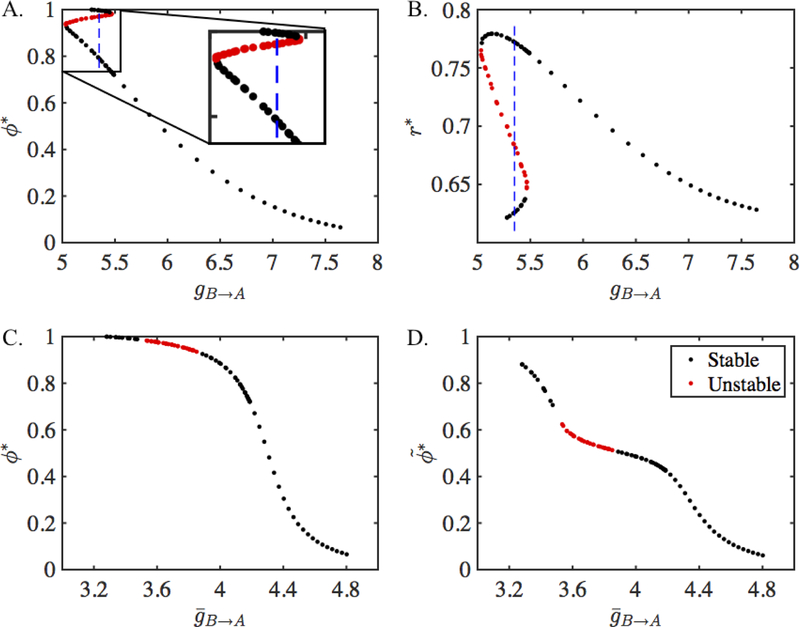
Fixed points of the 2-D map Πdyn given in Equation (26) and their equivalence with the fixed points of the map Π given in Equation (22). A. Steady-state intrinsic phase of neuron A obtained from Πdyn as a function of . Dashed vertical line at gB→A = 5.35 lies within the region of bistablity which is also shown in the inset. B. The steady-state value of the depression variable obtained from Πdyn as a function of . C. The steady-state intrinsic phase of neuron A obtained from the depressing map Πdyn is equivalent to the phase obtained from the static map Π (compare with Figure 4A) when plotted as a function of = gB→Ar*. D. The steady state activity phase of neuron A obtained from Πdyn.

