Figure 9:
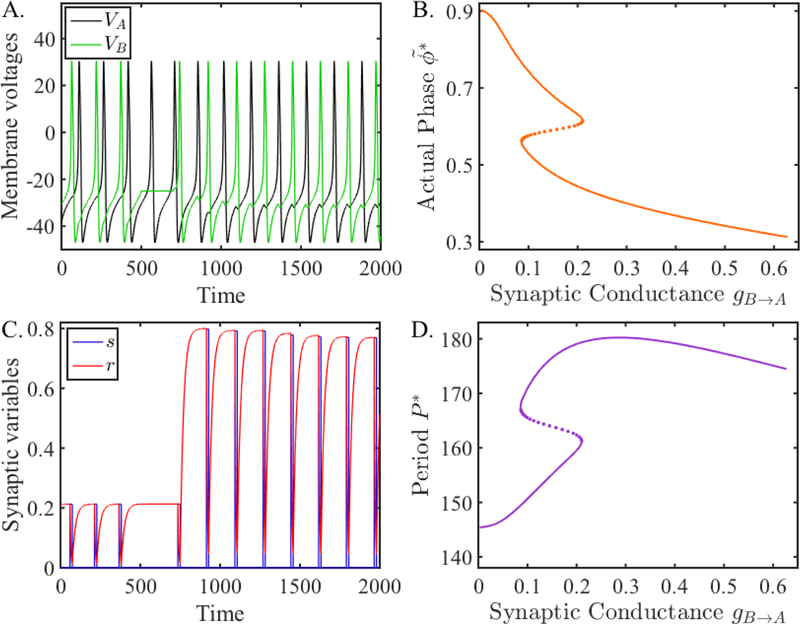
Simulation of coupled ML neurons compared with fixed points of the map Πss (31). A. Membrane voltages of two ML neurons coupled with inhibitory synapses when the B to A synapse is depressing. The network locks at two different phases. From t = 900 to 1, 100, neuron B is hyperpolarized, causing the network to switch to the other phase-locked solution. B. Activity phase versus synaptic conductance obtained from the map Πss. C. The evolution of the synaptic variables from neuron B to A. D. Period of neuron A (also neuron B) versus synaptic conductance obtained from the map Πss. The Z-shaped (S-shaped) curve in panel B (panel D) shows the different phases (periods) that exist over a range of conductance values of gB→A. The lower and upper branches represent stable solutions, while the dotted middle branch represents unstable solutions. The simulations in the left two panels occur for gB→A = 0.125, where for t < 900, the phase-locked solution corresponds to a point on the upper (lower) branch, and for t > 1100, the solution converges to a phase-locked solution on the lower (upper) branch.

