
Fig. 11.
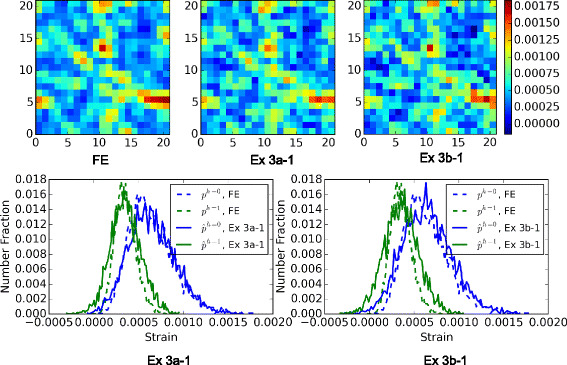
Comparison of strain field predictions. A comparison of FE and statistical model predictions of the strain fields, , in an example MVE with the volume fraction of 50 %. The models are those developed in Ex 3a −1 and Ex 3b −1. Strain fields on a center slice are compared at the top. Histogram plots of strain distributions are presented at the bottom. One hundred bins are used to generate each distribution curve for each phase