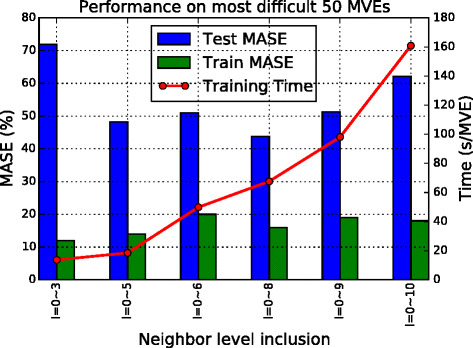
Fig. 5.

Results of Ex 1. Comparison of training time (line) and training and test errors (bars) with different numbers of microstructure inputs. Six variations are tested. Results shown are only for the 50 MVEs with volume fraction 48–53 % (these produce the highest errors). Most systems turn out to have a test error of over 50 %, which indicates the insufficiency of representation
