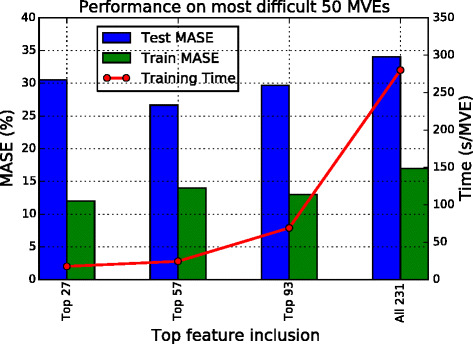
Fig. 6.

Results of Ex 2. Comparison of training time (line) and training and test errors (bars) with different numbers of top feature inclusions. The four systems from left to right correspond to Ex 2a, 2b, 2c, and 2d. Results shown are for 50 MVEs with volume fraction 48–53 %. Judging from the test MASE , the second system with 57 features outperforms the rest
