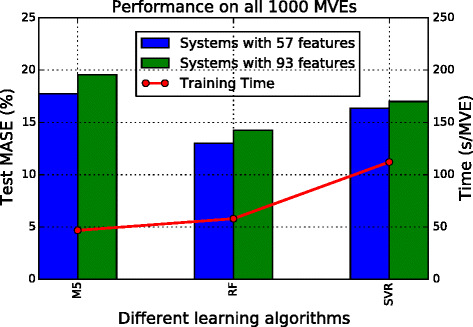
Fig. 9.

Results of Ex 3. Comparison of training time (line) and test error (bars) with different regressors making use of two variations of microstructure representations. The six systems from the very left bar to the very right correspond to Ex 2b, 2c, 3a −1, 3a −2, 3b −1, and 3b −2, while the training time depicted is an average of each adjacent pair under the same regressor. The reason for using the average is that the difference of feature sizes under the same model type is relatively trivial
