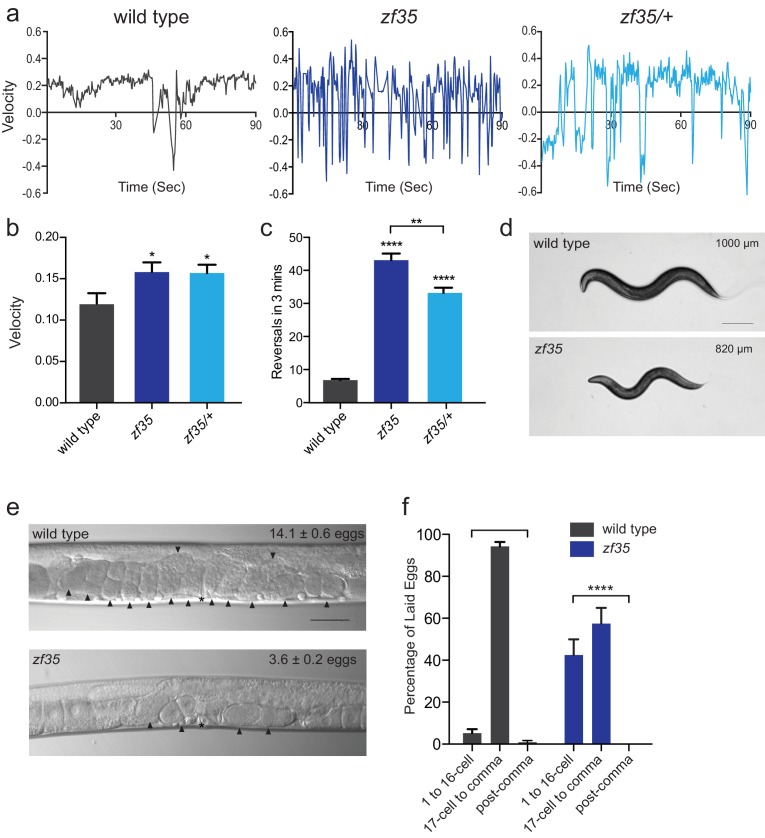
Figure 1. zf35 animals are hyperactive in both locomotion and egg-laying behaviors.
(a) Representative traces from single worm tracking showing instantaneous velocity of indicated genotypes on OP50 thin lawn plates (see Materials and methods). Positive and negative values indicate forward and backward locomotion, respectively. Transition from positive to negative values indicates reversal events. (b) Shown is the average velocity for the wild-type (0.118 ± 0.01 worm lengths/s, n = 9), zf35 (0.156 ± 0.01 worm lengths/sec, n = 10), zf35 /+ (0.155 ± 0.01 worm lengths/s, n = 10) animals (c) Quantification of the reversal frequency in 3 min on regular OP50 plates: average reversal numbers made by wild type (6.8 ± 0.4 reversals, n = 59), zf35 (43.1 ± 2.0 reversals, n = 59) and zf35/+ (33.2 ± 1.6 reversals, n = 23). Error bars represent SEM for at least three trials. Statistical difference from wild type *p<0.05, ****p<0.0001, one-way ANOVA with Dunnett’s multiple comparisons test. Statistical difference between zf35 and zf35/+ **p<0.01, unpaired t-test. (d) Representative images of wild type and zf35 animals. Average of midline lengths of the wild type: 1.00 ± 0.04 mm, n = 88 and zf35: 0.82 ± 0.03 mm, n = 75. Scale bar is 200 µm. (e) Representative Nomarski images of unlaid eggs in adult wild-type and zf35 animals. Arrowheads indicate eggs; asterisk denotes the position of the vulva. The average numbers of eggs in the uterus: wild type (14.1 ± 0.6 eggs, n = 80), zf35 (3.6 ± 0.2 egg, n = 86) animals. Scale bar, 50 µm. (f) Embryonic stages of freshly laid eggs of the wild type and zf35 mutants. 43% of the laid eggs from zf35 animals are at 1–16 cell stage, while only 5% from the wild type laid eggs are at 1–16 cell stage. Five independent trials with 75 animals for each genotype. Statistical difference from wild type ****p<0.0001, Chi-squared test.

