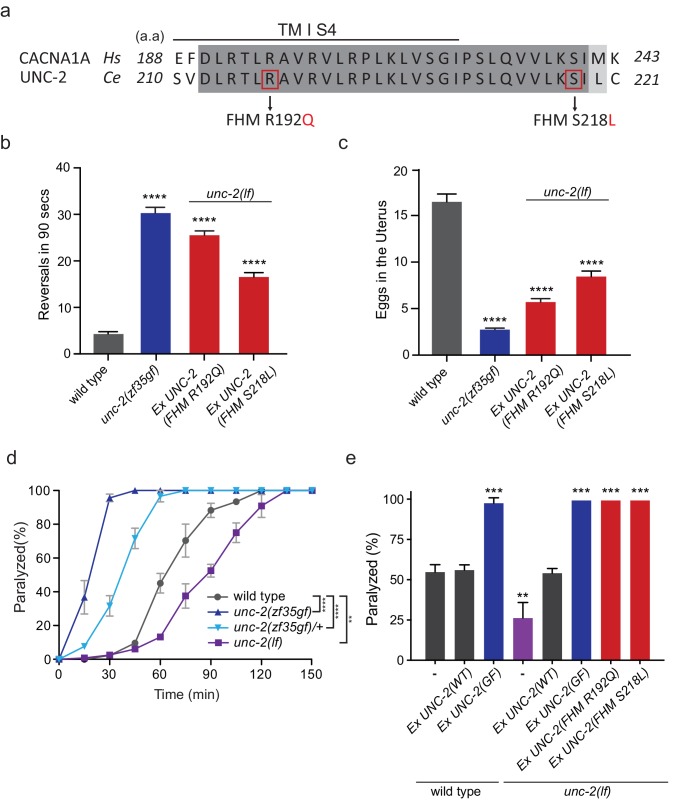
Figure 4. FHM1 mutations in unc-2 gene result in a hyperactive phenotype.
(a) The amino acid alignment of the conserved region of transmembrane domain I membrane-spanning segments 4 (TM I S4) and the following linker region from human (CACNA1A) and worm (UNC-2) CaV2α subunits. Identities are dark gray and similarities are light gray. Indicated are the known human FHM1 mutations: R192Q and S218L. (b) Shown is the average number of reversals in 90 s on thin lawn OP50 plates: wild type (4.2 ± 0.5, n = 29), unc-2(zf35gf) (30.3 ± 1.2, n = 20), Ptag-168::UNC-2(R192Q) (25.5 ± 0.9, n = 34), and Ptag-168::UNC-2(R192Q) (16.5 ± 0.9, n = 33). (c) Average numbers of eggs in the adult uterus: wild type (16.5 ± 0.8 eggs, n = 23), unc-2(zf35gf) (2.7 ± 0.2, n = 35), Ptag-168::UNC-2(R192Q) (5.7 ± 0.4, n = 37), and Ptag-168::UNC-2(S218L) (8.4 ± 0.6, n = 32). Each bar represents the mean ± SEM for at least three trials with indicated totaling animals number. Statistical difference from wild-type, ****p<0.0001, one-way ANOVA with Dunnett’s multiple comparisons test. (d) Quantification of paralysis on 1 mM aldicarb. Each data point represents the mean ± SEM of the percentage of animals paralyzed every 15 min. 50% of the wild-type animals were paralyzed at 60 min. unc-2(lf) animals were resistant to the effects of aldicarb and reached 50% paralysis at 90 min. Homozygous unc-2(zf35gf) mutants were sensitive to aldicarb; 50% of the unc-2(zf35gf) mutants were paralyzed at 20 min. 50% of heterozygous unc-2(zf35gf) mutants paralyzed at 40 min. Three independent trials with at least 50 animals for each genotype; **p<0.01, ****p<0.0001, two-way ANOVA with Tukey’s multiple comparisons test. (e) Quantification of paralysis percentage on 1 mM aldicarb at the 60 min time point: 55.5% ± 4.5 of wild type, 56.7% ± 3.3 of Ptag-168::UNC-2(WT) and 98.3% ± 3.3 of Ptag-168::UNC-2(GF) expressed in wild-type animals, 27.1% ± 7.3 of unc-2(lf) animals, 54.8% ± 2.9 of Ptag-168::UNC-2(WT), 100% of Ptag-168::UNC-2(GF), and 100% of Ptag-168::UNC-2(R192Q) and Ptag-168::UNC-2(S218L) in unc-2(lf) background. **p<0.01, ***p<0.001, one-way ANOVA with Dunnett’s multiple comparisons test.

