. 2019 Aug 5;8:e45905. doi: 10.7554/eLife.45905

Figure 7. The reduction of GABAA receptor in unc-2(zf35gf) mutants is dependent on nicotinic acetylcholine receptor mediated signaling.

(a and c) Representative images of GABAergic post-synaptic sites labeled with UNC-49::GFP of indicated genotypes. Scale bar represents 10 μm (b) Quantification of the fluorescence intensity of UNC-49::GFP along the nerve cord. Arbitrary fluorescence units of individual animals are normalized to the mean value of wild type. Normalized UNC-49::GFP fluorescence: wild type (1 ± 0.06, n = 41), unc-2(zf35gf) (0.4 ± 0.07, n = 15), Punc-47::UNC-2(GF) (1.5 ± 0.12, n = 13), Pacr-2::UNC-2(GF) (0.7 ± 0.07, n = 16), acr-12; unc-2(zf35gf) (1 ± 0.11, n = 15) and unc-29; unc-2(zf35gf) (0.9 ± 0.07, n = 14). (d) Quantification of the fluorescence intensity of UNC-49::GFP along the nerve cord of indicated genotypes. Arbitrary fluorescence units of individual animals are normalized to the mean value of wild type. Normalized UNC-49::GFP fluorescence: wild type (1 ± 0.04, n = 82), L-AChR(WT) (1 ± 0.05, n = 22), L-AChR(GF) (0.8 ± 0.05, n = 23), unc-2(zf35gf) (0.6 ± 0.07, n = 36), tax-6 (1.1 ± 0.06, n = 54), tax-6; unc-2(zf35gf) (1 ± 0.05, n = 29). For all the quantification above, error bars depict SEM. *p<0.05, ****p<0.0001, one-way ANOVA with Dunnett’s multiple comparisons. (e) Model: The UNC-2 gain-of-function mutation shifts the E/I balance to an excitation-dominant transmission through the destabilaztion of GABA synapses in a TAX-6/calcineurin-dependent manner (See text for explanation).

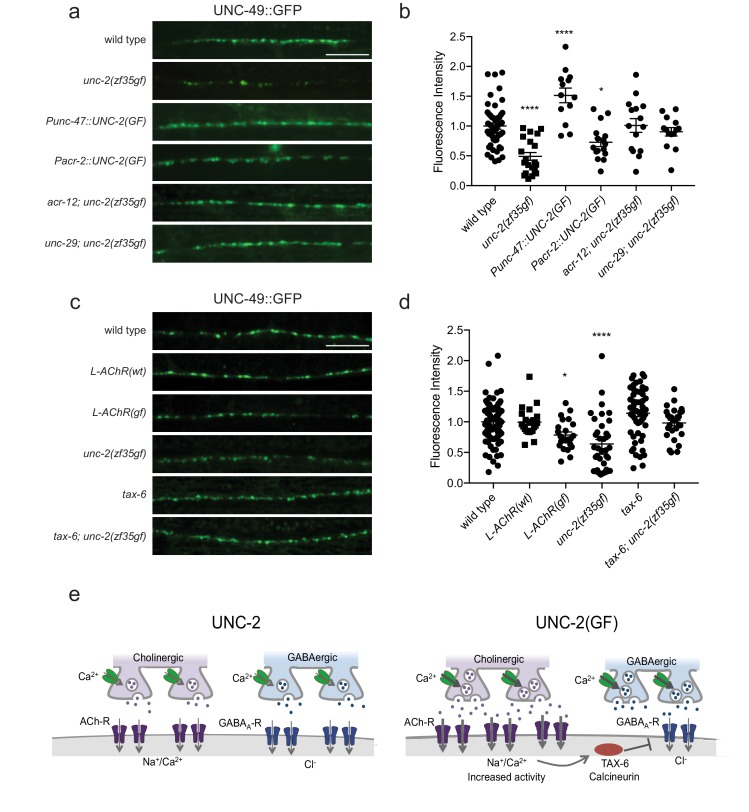
Figure 7—source data 1. Source data for Figure 7.
DOI: 10.7554/eLife.45905.030

Figure 7.

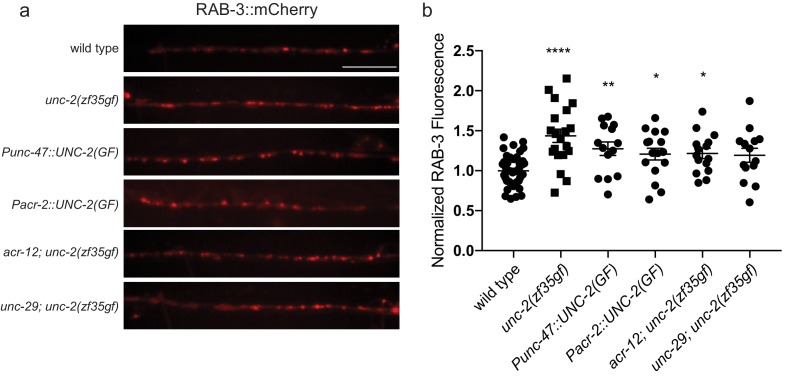
Figure 7—figure supplement 1. Quantification of RAB-3 vesicle marker in GABAergic synapses.

Figure 7—figure supplement 1.

(a) Representative images and (b) quantification of GABAergic presynaptic sites labeled with RAB-3::mCherry for indicated genotypes. Scale bar represents 10 μm. Arbitrary fluorescence units of individual animals are normalized to the mean value of the wild type. Normalized RAB-3::mCherry fluorescence: wild type (1 ± 0.05, n = 51), unc-2(zf35gf) (1.4 ± 0.07, n = 20), Punc-47::UNC-2(GF) (1.3 ± 0.08, n = 14), Pacr-2::UNC-2(GF) (1.2 ± 0.08, n = 16), acr-12; unc-2(zf35gf) (1.2 ± 0.06, n = 15) and unc-29; unc-2(zf35gf) (1.2 ± 0.08, n = 14). In the Punc-47::UNC-2(GF) and Pacr-2::UNC-2(GF) lines, the unc-2(zf35gf) transgene is specifically expressed in GABAergic or cholinergic motor neurons, respectively. Error bars depict SEM. *p<0.05, **p<0.01, ***p<0.0001, one-way ANOVA with Dunnett’s multiple comparisons.
Figure 7—figure supplement 1—source data 1. Source data for Figure 7—figure supplement 1.
DOI: 10.7554/eLife.45905.025
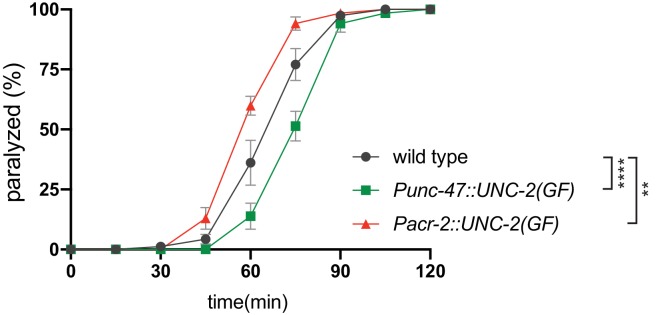
Figure 7—figure supplement 2. Cell-specific expression of unc-2(zf35gf) transgene in cholinergic or GABAergic motor neurons confers corresponding aldicarb response.

Figure 7—figure supplement 2.

Quantification of paralysis on 1 mM aldicarb. Each data point represents the mean ± SEM of the percentage of animals paralyzed every 15 min. Expression of the unc-2(zf35gf) transgene in cholinergic motor neurons (Pacr-2::UNC-2(GF)) makes animals hypersensitive to aldicarb, whereas expression in GABAergic neurons (Punc-47::UNC-2(GF)) increases resistance to aldicarb. Five independent trials with totaling at least 50 animals for each genotype. **p<0.01, ****p<0.0001, two-way ANOVA with Tukey’s multiple comparisons test.
Figure 7—figure supplement 2—source data 1. Source data for Figure 7—figure supplement 2.
DOI: 10.7554/eLife.45905.027
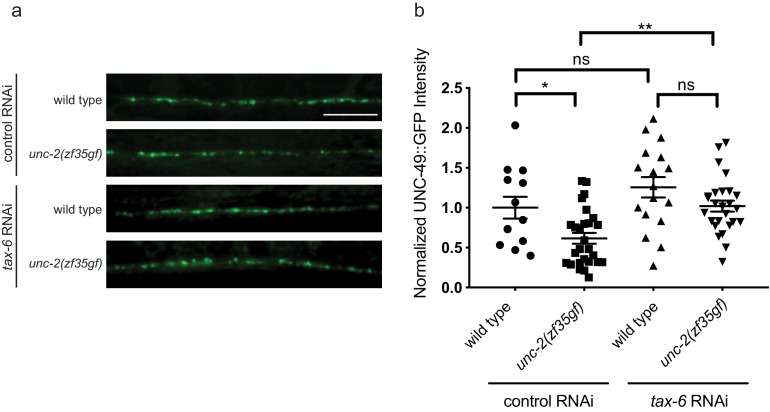
Figure 7—figure supplement 3. Knocking down tax-6 gene expression in non-neuonal cells is sufficient to suppress the reduction of UNC-49::GFP in unc-2(zf35gf) mutants.

Figure 7—figure supplement 3.

Representative images and quantification of the fluorescence intensity of UNC-49::GFP along the nerve cord of indicated genotypes and treatments. Arbitrary fluorescence units of individual animals are normalized to the mean value of the wild type. Normalized UNC-49::GFP fluorescence: wild type treated with control RNAi (1 ± 0.14, n = 13), unc-2(zf35gf) treated with control RNAi (0.62 ± 0.07, n = 25), wild type treated with tax-6 RNAi (1.26 ± 0.13, n = 17), unc-2(zf35gf) treated with tax-6 RNAi (1.02 ± 0.07, n = 26). For all the quantification above, error bars depict SEM. *p<0.05, **p<0.01, one-way ANOVA with Tukey’s multiple comparisons.
Figure 7—figure supplement 3—source data 1. Source data for Figure 7—figure supplement 3.
DOI: 10.7554/eLife.45905.029