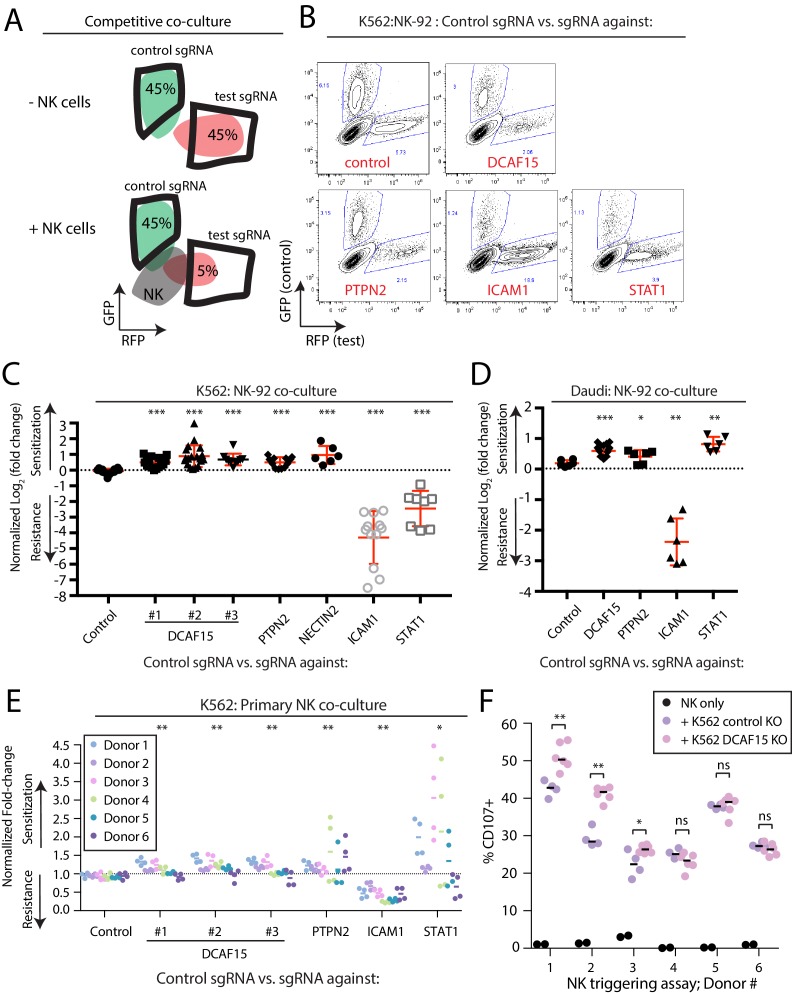
Figure 3. Disruption of the E3 ubiquitin ligase substrate adaptor DCAF15 enhances NK effector functions.
(A) Experimental design of competitive co-culture experiments, with FACS data illustrating a hypothetical sgRNA that enhances NK-mediated target cell clearance. (B) Representative results from NK-92:K562 competitive co-culture experiments performed at a 2.5:1 E:T ratio. (C) Results of competitive co-culture performed at a 2.5:1 E:T ratio and measured 48–96 hr after challenge of K562 cells with NK-92 cells. Mean and standard deviation are shown. *** p-value<0.0001, Mann-Whitney test. (D) Results of competitive co-culture performed at a 1:1 E:T ratio and measured 48–96 hr after challenge of K562 cells with IL-2 activated isolated peripheral NK cells. ** p-value<0.01, * p-value=0.06, Wilcoxon matched-pairs signed rank test. (E) Results of competitive co-culture performed at a 2.5:1 E:T ratio and measured 48–96 hr after challenge of Daudi cells with NK-92 cells. Mean and standard deviation are shown. *** p-value<0.0001, ** p-value=0.0022, * p-value=0.09, Mann-Whitney test. F)Flow cytometry analysis of NK cell degranulation (cell surface CD107A expression) after 2 hr coculture of primary NK cells with indicated target cell types at 2.5:1 E:T ratio. Line indicates median value. ** p-value=0.095, * p-value=0.067, NS p-value>0.10, Mann-Whitney test.


