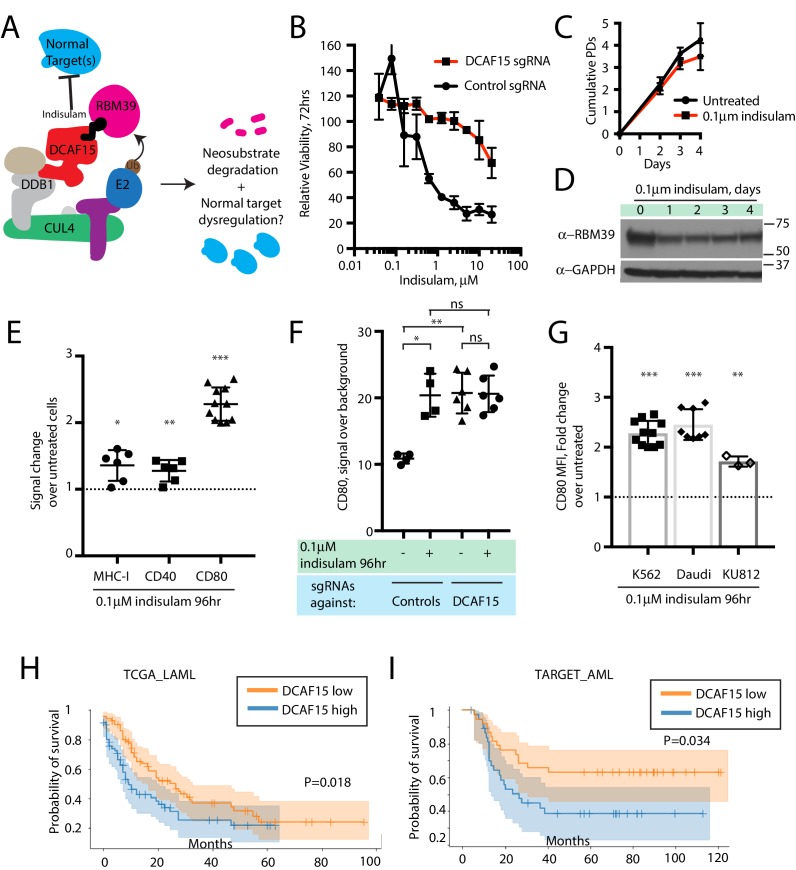
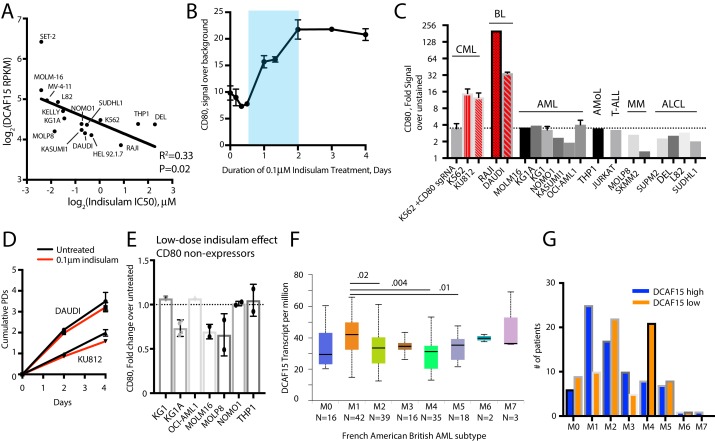
Figure 6. The anti-leukemia drug indisulam inhibits DCAF15 function.
(A) Proposed model for DCAF15 gain- and loss-of-function phenotypes triggered by indisulam treatment. (B) Dose response of K562 cells expressing the indicated sgRNAs to indisulam. Relative viability measured by ATP content. N = 2 experiments. Mean and standard deviation are shown. (C) Growth of K562 cells treated with 0.1 μM indisulam over 4 days. N = 12 per timepoint. Mean and standard deviation are shown. (D) Western blot for total RBM39 levels in K562 cells after 0.1 μM indisulam treatment for the indicated number of days. (E) Flow cytometry measurements of the indicated cell surface markers in K562 cells after indisulam treatment. Mean and standard deviation are shown. ***p<0.0001, **p=0.0085, *p=0.013, mean significantly different from 1, one sample T test. (F) CD80 expression measured by flow cytometry in indisulam-treated K562 cells expressing the indicated sgRNAs. Mean and standard deviation are shown. N = 4–6 samples. **p=0.0095, *p=0.0286, ns p>0.1, Mann-Whitney test. (G) Effect of indisulam treatment on CD80 expression in the indicated cell lines. N = 3–12 samples. Mean and standard deviation are shown. ***p<0.0001, **p=0.0066, mean significantly different from 1, one sample T test. (H) Kaplan-Meier analysis of overall survival in adult AML patients from TCGA LAML project stratified by DCAF15 expression. ‘DCAF15 high’ and ‘DCAF15 low’ represents patients in top or bottom 50% of DCAF15 expression, respectively. N = 142 patients. 95% confidence interval shown. Median survival, 16.17 vs 12.18 months. P-value from log-rank test. (I) Kaplan-Meier analysis of overall survival in pediatric AML patients from TARGET project stratified by DCAF15 expression. ‘DCAF15 high’ and ‘DCAF15 low’ represents patients in top or bottom 20% of DCAF15 expression, respectively. N = 76 patients. 95% confidence interval shown. Median survival, 21.17 vs NA. P-value from log-rank test.


